
eMagiz Debugger
In this microlearning, we'll dive into how to effectively use the debugger in eMagiz to troubleshoot and validate your integration solutions. We'll guide you through the various testing options available, from flow testing during the build phase to using the queue browser and analyzing error logs after deployment. When these methods aren't enough, the debugger can provide additional insights. We'll cover how to set up and utilize the debugger, along with important limitations and best practices to ensure efficient and accurate debugging.
Should you have any questions, please contact academy@emagiz.com.
1. Prerequisites
- Intermediate knowledge of the eMagiz platform
- Your JMS server is running on the current generation architecture.
- The store item called "Debugger" is imported in the infra flow of each runtime for which you want the ability to debug
- A new release is created that includes the flow changes, and this release is deployed to the environment(s)
2. Key concepts
- The debugger is one of the many options in eMagiz to test and validate your integration solution.
- Testing in eMagiz should be done in phases
- Start with flow testing while building.
- When finished building, automate one (or more) flow test(s) to identify regression issues.
- After deploying, validate the solution with the help of the queue browser and by checking the error messages and log entries.
- Should all this not provide answers, you can use the debugger functionality.
3. eMagiz Debugger
3.1 Order of testing in eMagiz
3.1.1 Flow Testing
When building your integration solution in eMagiz, we provide several options to validate whether your proposed solution works. In the Create phase, we have the flow testing functionality. As eMagiz, we advise using the Flow Testing feature so that the functionality can already be tested during the Create phase. There is no need to deploy anything yet, or stop/start certain parts of the eMagiz deployed flows. Because flow testing not only shows the messages as they pass through the channels but also provides feedback on your test scenarios, we advice you to use flow testing when you can.
3.1.2 Queue Browser
After you have deployed your solution to a specific environment, you can navigate to Manage -> Explore -> Queue browser to search for the queue for which you want to observe what is passing along. You can do this with the help of the "Wiretap" option. For more information on the queue browser, please see our release blog on the subject.
3.1.3 Analyzing error messages and log entries
When a message does not arrive on the queue, you can analyze the Error Message Dashboard to determine the cause of an error messages or when the problem occurs in a flow for which no error handling is configured. Still, errors are written in the log. It would be best to verify the log entries.
3.1.4 Debugger
Once the methods above are insufficient in getting an answer to the question you are facing, you can use the debugger functionality of eMagiz to help find your answer. In the remainder of this microlearning, we will explain how you can configure your model so that the debugger functionality is ready to be used and how you can work with the debugger.
3.2 Setting up the debugger
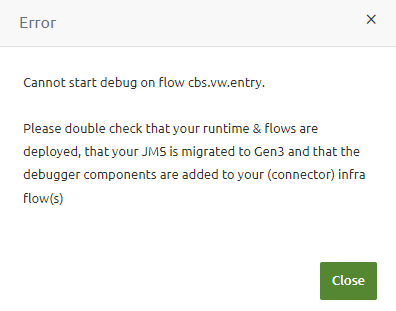
Before you can use the debugger in your model, several steps need to be executed. At first, you need to migrate your complete model to the current generation architecture. You can find a migration path towards the current generation architecture here. Subsequently, you need to import the store item "Debugger" into any runtime infra flow for which you want to debug any flow that should run on that runtime.
When you have done so, a new release needs to be created and deployed containing these changes.
3.3 Working with the debugger
As with our current offering, we now offer functionality with which you can debug channels and see them via the eMagiz portal. As stated above, to get to this point, you must execute several steps to get your model ready to be "debugged." Once you have done this, you can activate the "debug" mode via Deploy -> Containers for one specific flow per runtime that is particularly interesting to you. Once you have done this, you will see a pop-up telling you whether the "debug" mode was activated.
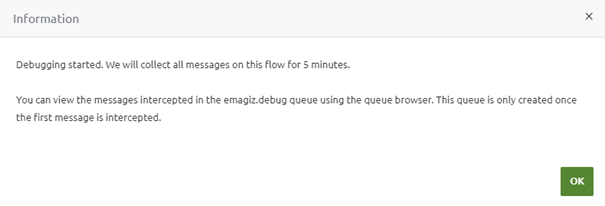
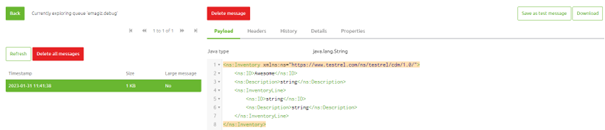
Assuming it was activated correctly, you can navigate to Manage -> Explore -> Queue browser and select the emagiz.debug queue to see the messages coming through.
4. Key takeaways
- Use flow testing when you can.
- Use the queue browser and analysis of the error messages and log entries to analyze problems before starting to debug
- The debugger has some limitations that you need to take into account when embedding its use within your processes
- Don't fire up debug screens for each separate flow in the process. Think before you test about what you want to test and where the test will most likely fail or pass. Debug only that flow.
- Don't change the settings eMagiz provides you by default
- Try to avoid debugging on Production, instead, reproduce the issue on Test or Acceptance.
- Users without deploy rights on a particular environment can also not debug on that environment, so that you can limit the use of the debugger.