
Monitoring partition size
Topics are a vital part of any Event Streaming solution. Each topic will have an assigned size, and understanding the size across time and context is important to ensure the right sizing is chosen for these topics.
Should you have any questions, please get in touch with academy@emagiz.com.
1. Prerequisites
- Advanced knowledge of the eMagiz platform
- Complete relevant Event Streaming microlearnings from Crash course to Intermediate
2. Key concepts
Based on the lines you drew in Capture, eMagiz automatically generates a topic. In other words, for each line you draw in Capture, eMagiz will create an accompanying topic. As a reminder, a topic is a category/feed name to which event records are stored and published. All Kafka records are organized into topics. Producer applications write data to topics, and consumer applications read from topics. Records published to the cluster stay in the cluster until a configurable retention period has passed by.
3. How to monitor partition sizing
In the Design phase, you can set the required partition size. Given the number of partitions, eMagiz automatically calculates the topic size. That partition size is the retention size, which means that once the topic size reaches that threshold, the retention policy will ensure that the oldest messages on the partition are deleted.
Understanding whether the design size is sufficient to serve the business process for which the topic was created is relevant. If there is insufficient partition size, it could mean that some messages are deleted too early and not considered for the business process. Furthermore, there are limits to partition size in the eMagiz Cloud. An oversized topic could mean that other topics will need more storage. Some test topics are configured with too much storage, negatively influencing the overall size.
To make the right decisions and configuration for partition sizing, you can review the actual size of each partition in the Manage phase. Navigate to the Manage phase and select the Monitoring section. In the left-hand menu, you will see the option Event Streaming Statistics. This page will show an overview of all relevant event streaming information.
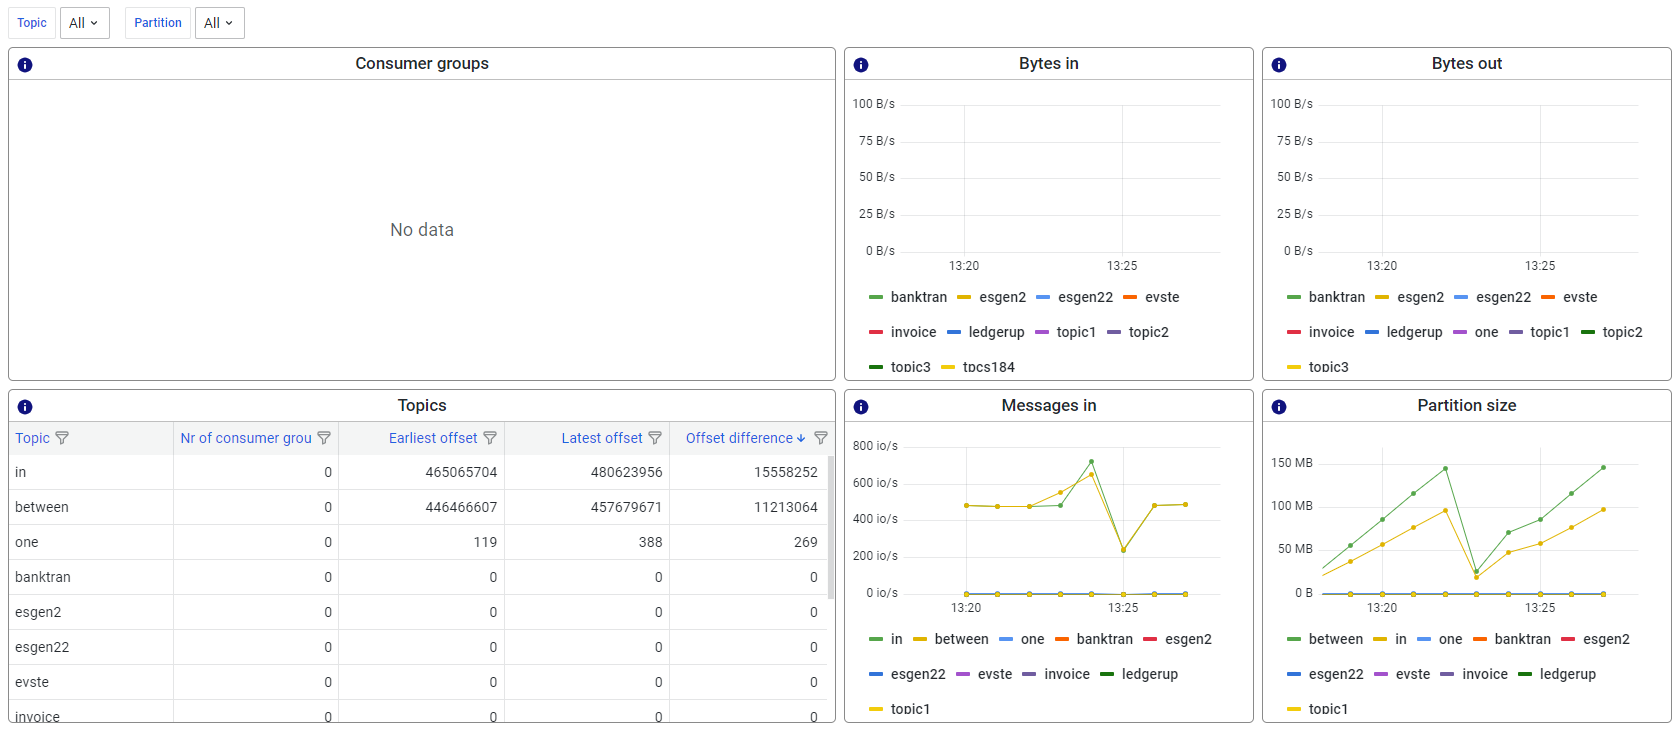
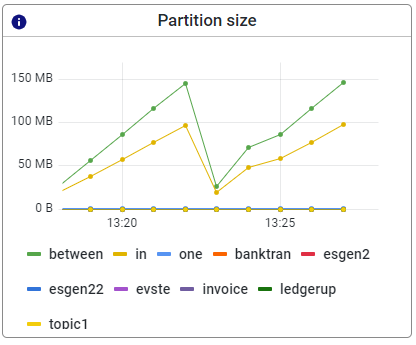
The graph on the bottom-right of your screen indicates the partition size and how it evolves.
4. Key takeaways
- Topic statistics are available in the Manage - Monitoring section and can be used to see the actual average size of the partitions of a topic.
- Decisions around the sizing of partitions can be made using these monitoring data points to determine the optimal configuration of topics across environments
5. Suggested Additional Readings
If you are interested in this topic and want more information, please read the release notes provided by eMagiz.