
HTTP Statistics
In this microlearning, we'll delve into the HTTP statistics available through each hosted web service. These metrics are designed to give you a clear understanding of how web service interactions are functioning, including the volume and success rates of requests. We’ll explore the key metrics and graphs available, how to navigate the dashboard, and how to use these insights to monitor and optimize performance. Let’s get started by examining how you can interpret and leverage these statistics effectively.
Should you have any questions, please get in touch with academy@emagiz.com.
1. Prerequisites
- Advanced knowledge of the eMagiz platform
- Complete relevant API Gateway microlearnings from Crash course to Intermediate
2. Key concepts
The API Gateway statistics are geared towards understanding the level of interaction between the API callers and the webservice of the API gateway. With the objective to understand the bredth and depth of the usage of the operations published.
3. Monitoring HTTP Statistics metrics
Below the various insights provided for HTTP traffic on an API Gateway.
3.1 Dashboard metrics
When browsing to the HTTP Statistics page, accessible via the Manage - Monitoring section, you can find a view similar to the one below.
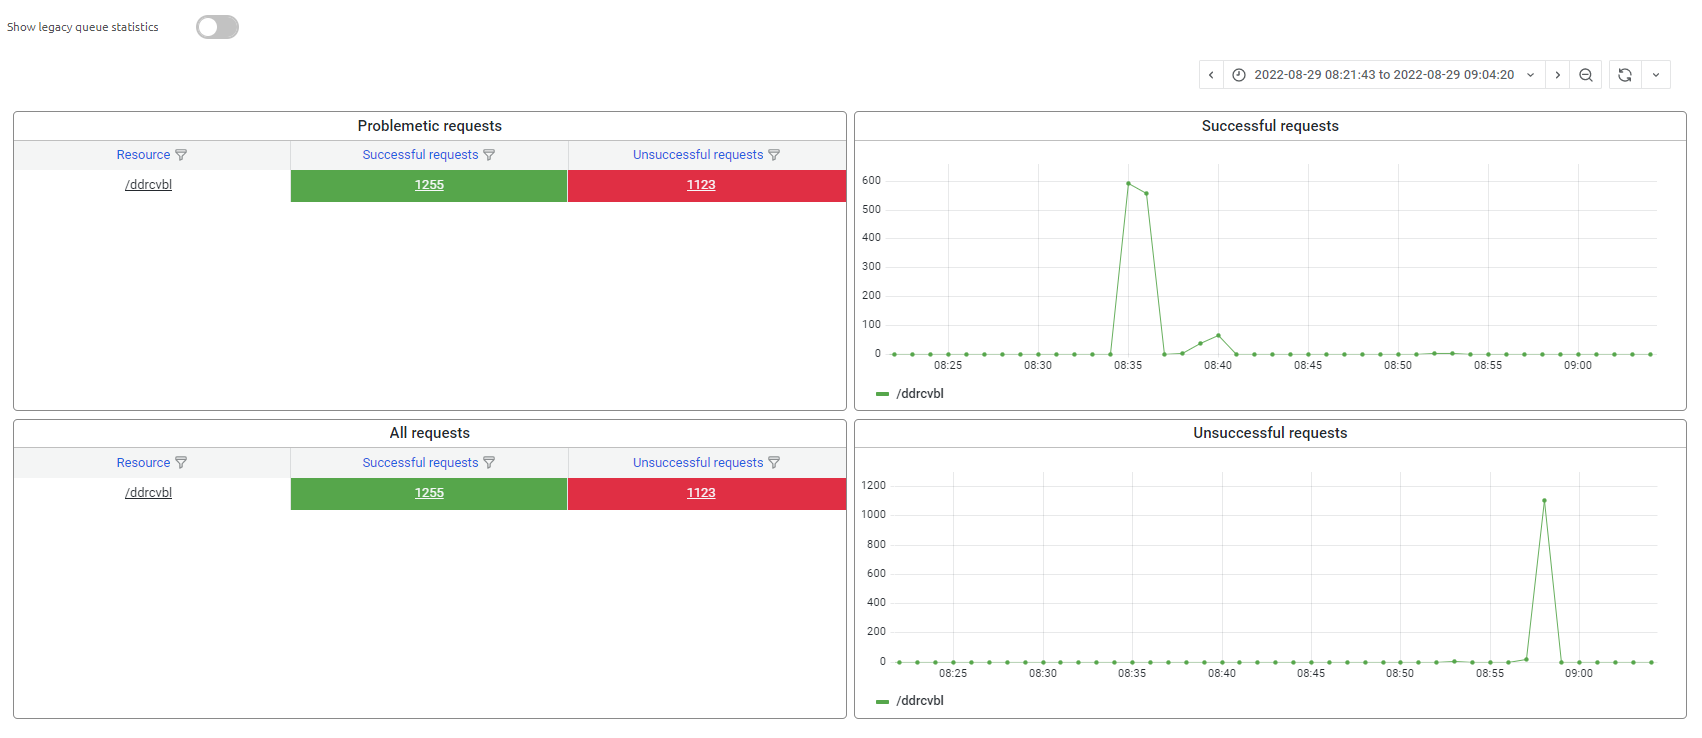
These are the key explainations for this view:
- Problematic requests display request from API callers that contain 1 or more unsuccessful requests
- All request displays all requests made in a certain interval
- For both view you can filter our specific API Callers to zoom in to. Use the reverse hourglass on the column header
- In the two graphs, you can find out the spread of successful and unsuccessful requests throught time.
- The time interval for research can be found at the top right of the 4 quadrants
3.2 Key metrics
Once you click on a specific API resource, you will drill down into the data. The page that follows is divided into two sections. The first one is key metrics which is described below. The other sections called "Other metrics" is explained in the expert level microlearnings.
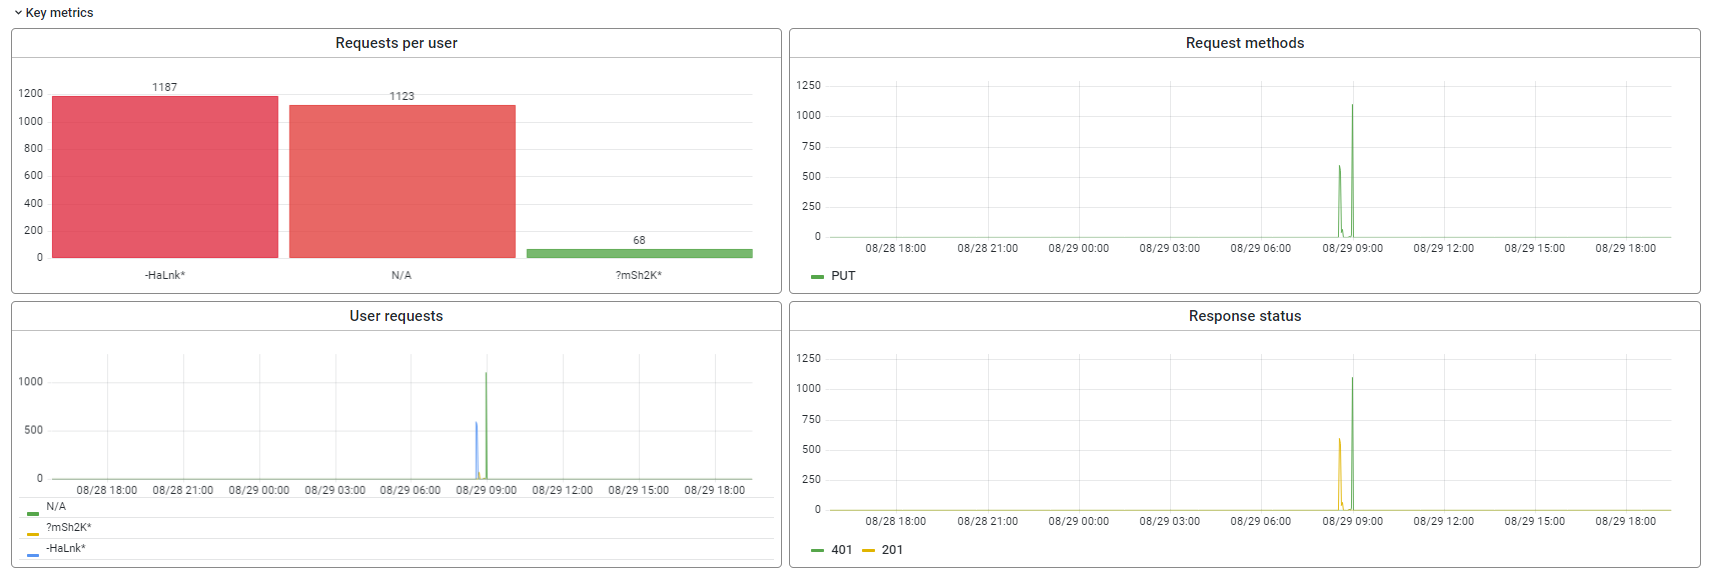
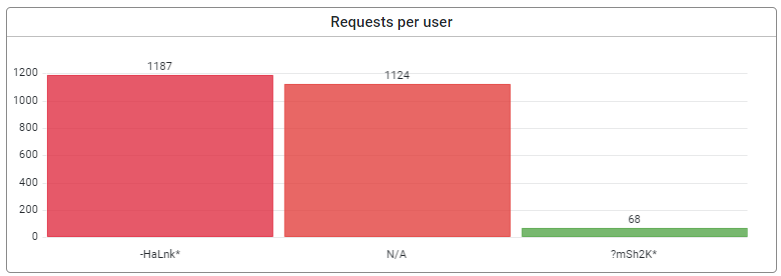
3.2.1 Request per user
In this view, one can see what users have used this API operation within the time interval selected. The users are listed on the horizontal axis, and each bar represents the number of requests of that user. The filtering allows to make selections of users in case there are many users that have made the request within the interval selected.
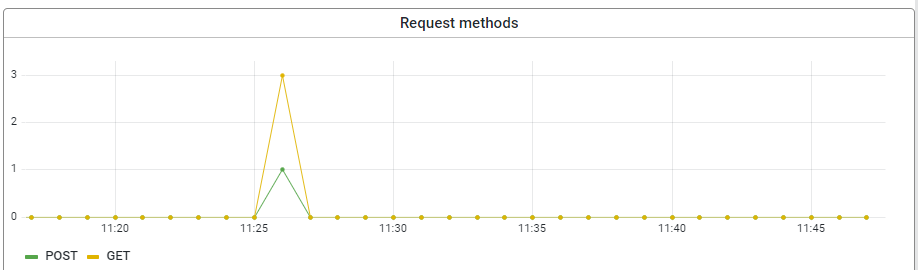
3.2.2 Request methods
In this view, one can see the number of HTTP methods (GET, POST, PUT, etc) through time. The colored line represent the methods, and the count is listed in the Y-axis. The filtering allows to update the view based on selection of resource, user, method and response code.
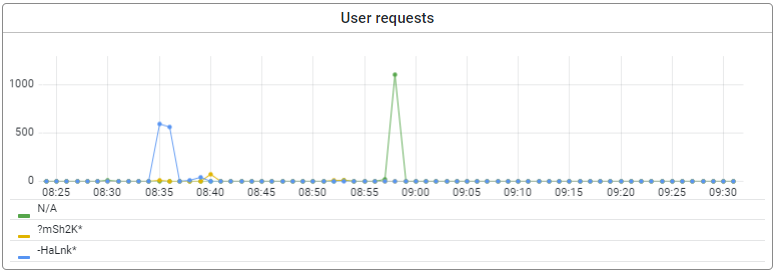
3.2.3 User request
In this view, one can see the time in which users make requests. To allow the analysis of request through time, and to identify what users have done when. The filtering allows to update the view based on selection of resource, user, method and response code.
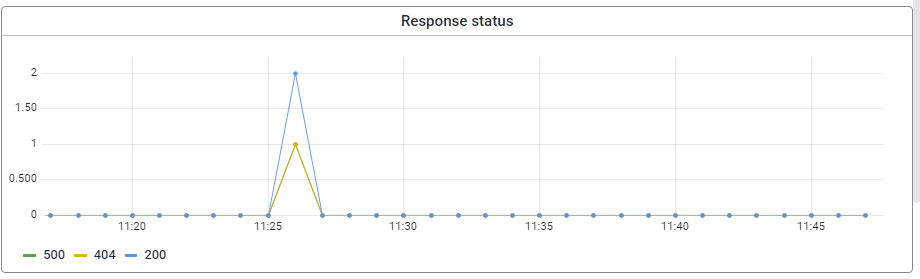
3.2.4 Response status
In this view, the HTTP response codes can be analyzed. The colored lines represent the different response codes - the Y-axis contains the number - the X-axis the time interval selected. The view helps to analyze what requests have a code 403 for instance, which users and/or methods where involved.
3.3 Other metrics
The other metrics provide some additional insights beyond the key metrics. These can be used for specific scenario's to monitor the HTTP traffic. Below the various graphs offered.
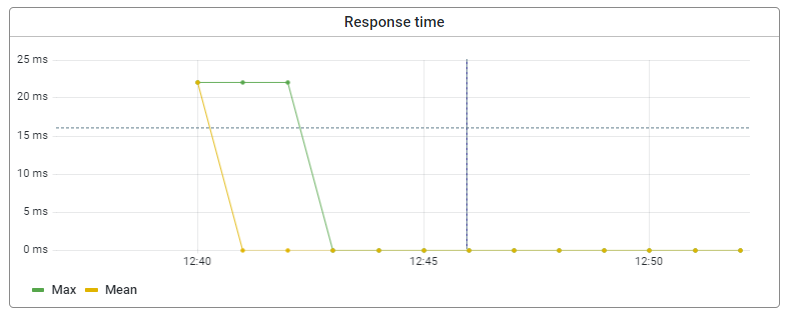
3.3.1 Response times
This graph shows the maximum time measured for a request and the average time of a request. The values are handy to see what the total time from start of the request made by the API user to the moment the response is received by the API user.
4. Key takeaways
- The landing page for HTTP statistics contains an overview of the successful and unsuccesful request as a starting point for futher analysis
- The key metrics provide more insights into the different aspects of a request such as users, methods, reponses and resources
- Using the drag and select option, it is easy to zoom in. Using the time interval selector specific timings can be selected to support analysis