
Monitoring State Generation Statistics
In a previous microlearning, we discussed storing state data for later use, with the available persistence options. So, it becomes important to be able to review the statistics of your State Generation operations. These statistics show the overall status of storage used to for your solution and will provide support in investigating the effectiveness and impact of your solution. In this microlearning, we will then explore on the available statistics and what to understand from them.
Should you have any questions, please get in touch with academy@emagiz.com.
1. Prerequisites
- Advanced knowledge of the eMagiz platform
- Complete relevant State Generation microlearnings from the Intermediate level
2. Key concepts
The State Generation statistics are tailored to help you understanding the performance and working of your state generation implementation. Important to know is that the graphs here provide information about your metastore components.
- With metastore components: we mean the state storage components that keep your state data (e.g., metadata store and message store).
Another important note to mention here is that, if you use the State Generation components without a metastore (and underlying support components), then no graphs will be generated.
3. Monitoring State Generation Statistics metrics
As mentioned earlier, the State Generation statistics are designed to help you understand the performance and operation of your state generation implementation. You will have access to these statistics once your model is granted a license to use the state generation functionality. After that, you can access the State Generation statistics under Manage -> Monitoring -> State Generation. There you will find the dashboard that includes four graphs, with each line representing one of the configured metastores. We will then explore, in the following sections, the graphs that are related to the metastore within your State Generation solution.
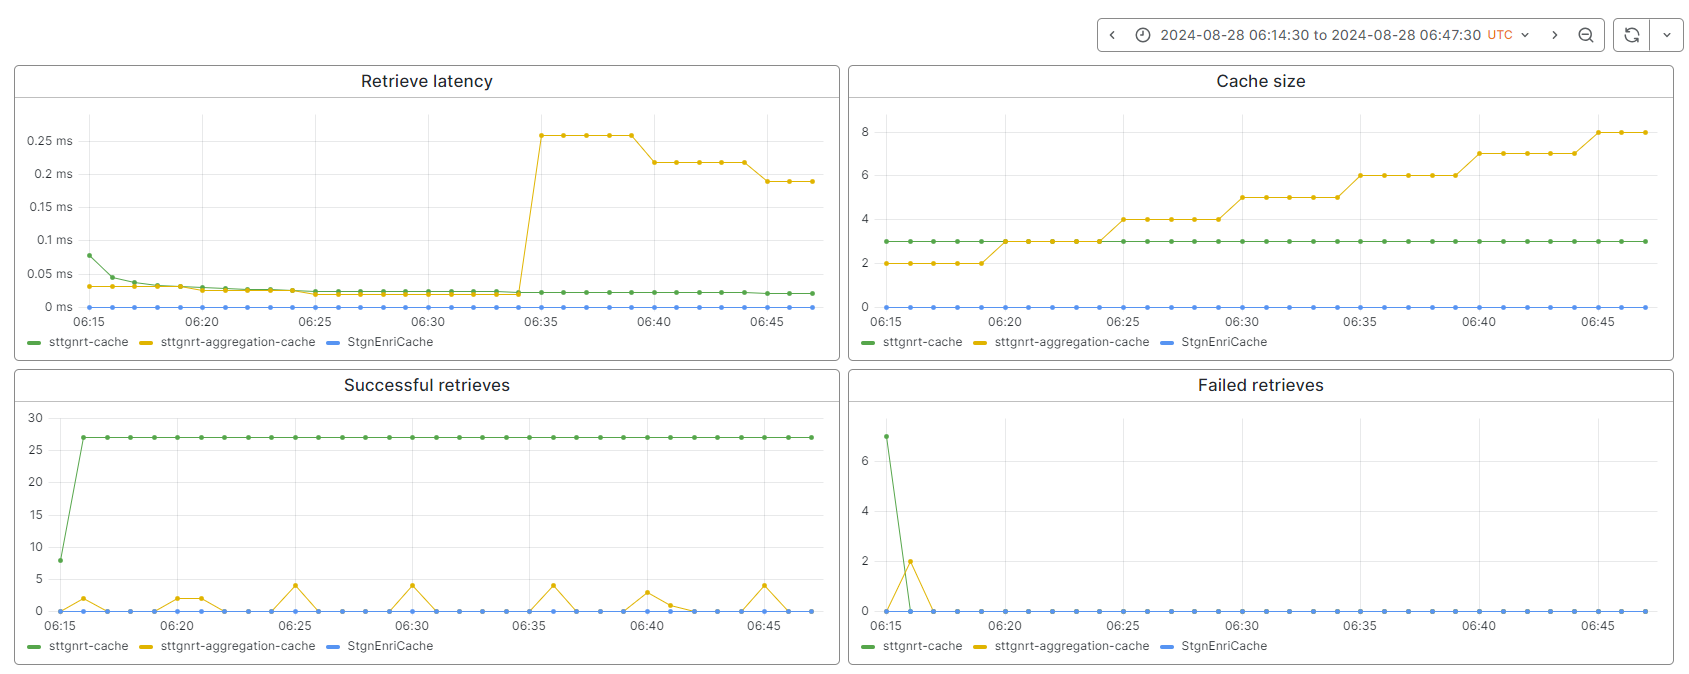
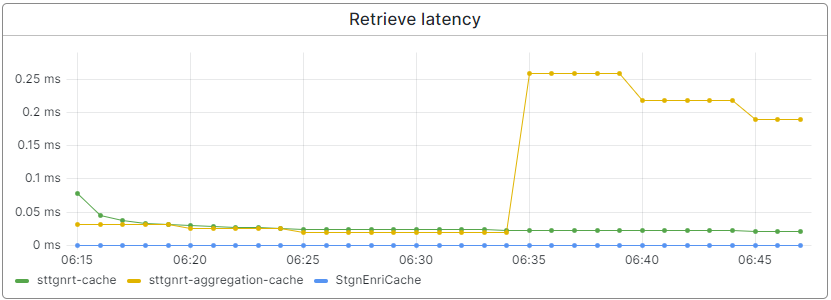
3.1 Retrieve Latency
The graph on the top left is about the retrieve latency. This is how fast on average the metastore can conclude requests made by a state generation component to get information from the metastore at a certain point in time.
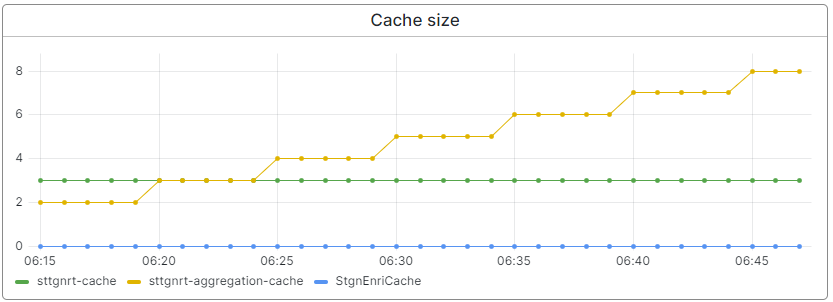
3.2 Cache Size
On the top right, we show the graph about the cache size. This show how many entries (Y-axis) are stored within you metastore at a point in time, which depends heavily on your configuration. The most influential factors are the eviction policy and expiration policy configurable in the metastore component.
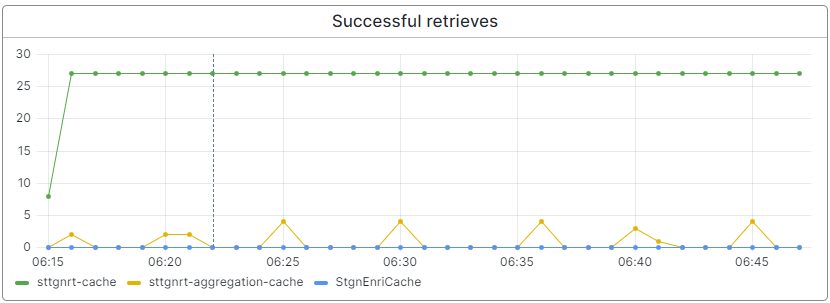
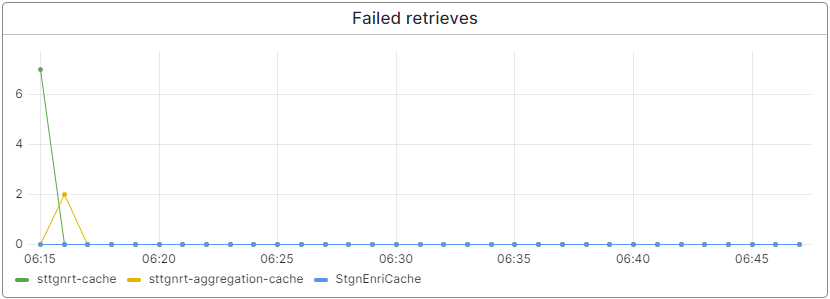
3.3 Successful & Failed retrieves
In the graphs on the lower half of the dashboard, we have two graphs showing how much retrievals are done to your metastore. On the left the successful retrievals are shown, on the right the unsuccessful. A succesful retrieve (displayed on the Y-axis) means that the requested entry in the call retrieved a value from the metastore. A failed retrieve means that no value has been found when searching in the metastore. Important to know is that this does not mean that the call itself failed.
4. Key takeaways
- The State Generation statistics page shows graphs about the performance of your working State Generation Solution.
- State Generation solutions without metastore will not provide any metrics.
- Using the drag and select option, it is easy to zoom in. Using the time interval selector specific timings can be selected to support analysis.