Runtime Statistics - Key metrics
In this microlearning, we’ll explore the key metric graphs available in eMagiz’s runtime statistics dashboard. These graphs offer valuable insights into system performance, including memory usage, CPU load, log events, and thread activity. Understanding these metrics will help you assess the health of your integration solution and address any performance issues effectively.
1. Prerequisites
- Basic knowledge of the eMagiz platform
- Understanding of the Runtime statistics Dashboard pages
2. Key concepts
- Key Metric Graphs: These are the first visuals presented when accessing runtime statistics. They provide a comprehensive overview of the system’s performance.
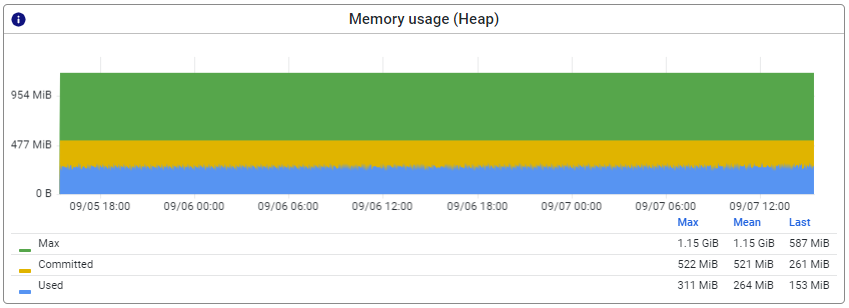
- Memory Usage - Heap: This metric shows how message traffic impacts heap memory, which is used for processing messages, including their transformation and transport through channels. High heap memory usage could indicate insufficient assigned memory for the message traffic.Runtime, Queue and HTTP metrics are send to the Manage phase every minute and that interval is runtime specific
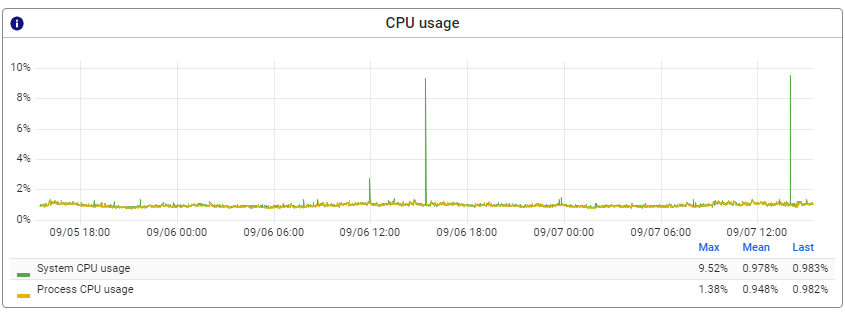
- CPU Usage: This graph displays the percentage of CPU usage assigned to the process (in this case, runtime). High CPU usage could suggest that the CPU is heavily engaged in handling message traffic, potentially causing delays or issues for other processes managed by the same CPU(s).
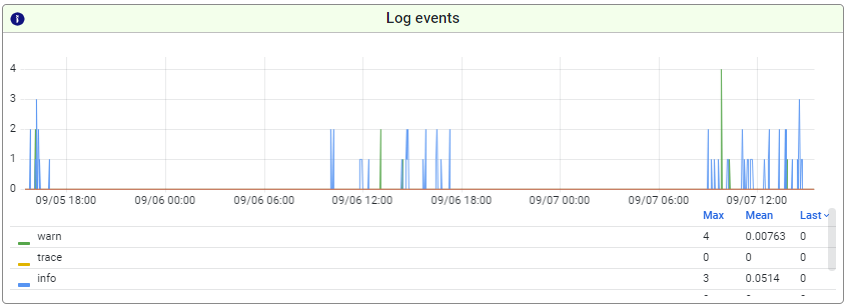
- Log Events: This graph illustrates the frequency of log entries over time, with different colors representing different types of log entries. This information can be useful in identifying patterns and rhythms in log entries.
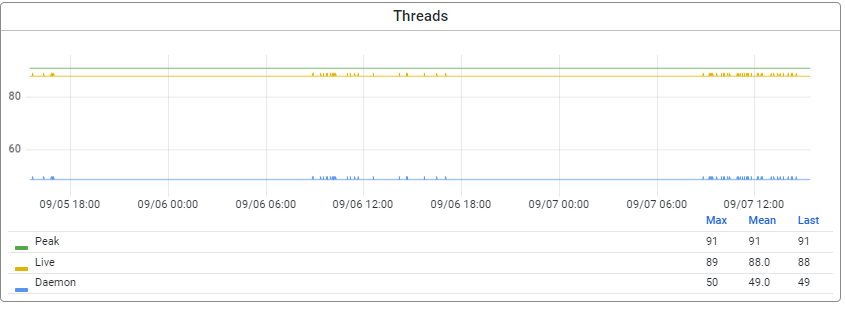
- Threads: This graph represents the number of live threads currently running on your JVM (runtime). Each thread corresponds to a task executed on the JVM, such as message consumption or queue registration. A continuously increasing number of live threads could indicate a problem.
3. Interpreting Runtime Statistics Key metrics
Assessing the health of your systems is critical in a stable and robust integration solution. One of the aspects of assessing the health of your systems is looking at the runtime statistics. Further to the Crash Course Microlearning around the Runtime Statistics Dashboard, this section will explain the Key metrics graphs.
3.1 Key Metric Graphs
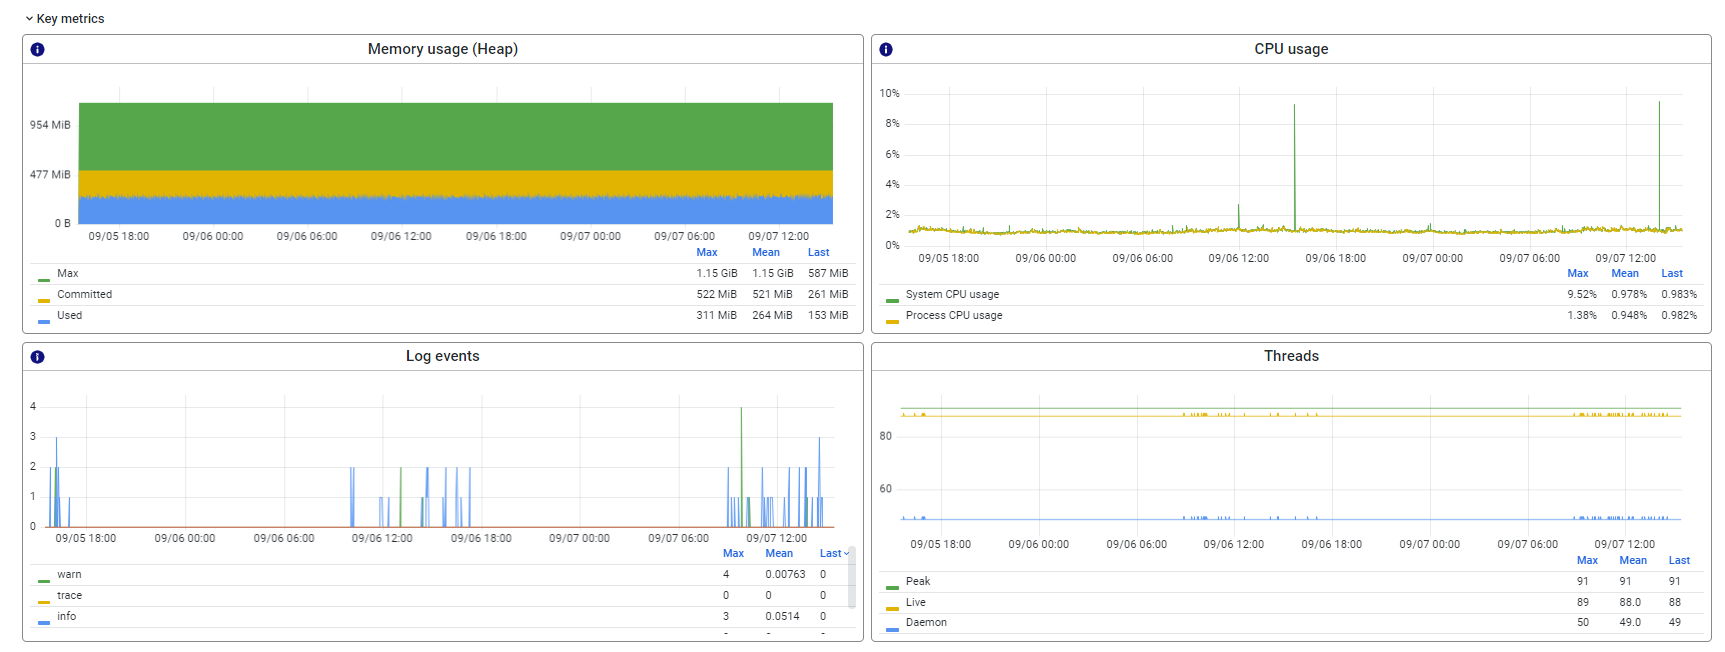
When the runtime statistics are accessed, the first page shows a dashboard of the runtime statistics. An example is mentioned below.
3.2 Memory usage - Heap
The heap memory section displays the way in which message traffic is impacting heap memory. Heap memory is used for processing messages including transformation and transport of messages through channels. Whenever the heap memory is high in % used, it means the assigned heap memory might be insufficient for the message traffic.
3.3 CPU Usage
This graph shows the usage percentage of the CPU assigned to the process (in this case runtime). The CPU is relevant for eMagiz as that component processes the message transformation, transport etc. A high percentage indicates that the CPU is very busy handling the message traffic of that process, which indicates that other processes handled by that same CPU(s) might experience delays or issues. The graph also shows the System CPU usage - this is the CPU of the system where the runtime is running in (usally the docker instance of machine).
3.4 Log events
This graph shows the occurrences of log entries through time - the different colored lines represent the type of log entry (Log, Warning, etc.). Please make sure that you can see the colors of each type by scrolling down on the graph level. This information can be helpful to identify the timings and rhythym of log entries.
3.5 Threads
The graph shows the number of live threads that are currently running on your JVM (runtime). Each thread represents a task that is executed on that JVM. This could be the consumption of a message, the registration of a queue, etc. An ever-growing number of live threads indicates that there might be something wrong.
4. Key takeaways
- There are 4 dashboard graphs that will help the more detailed analysis of a runtime(s)
- Next to CPU and memory consumption, a first view of logs and threads can be helpful to asses the health of a runtime
- The added value lies in combining the information from each of them into a coherent interpretation

