
Runtime Metrics - Other metrics
In a previous microlearning we learned how the runtime statistics could be interpreted from an overview page. Based on that, we have expanded on this by zooming in on the key runtime metrics in this microlearning. In this microlearning, we will explore the "other" metrics available in eMagiz for runtime monitoring. By segmenting these metrics into categories like memory management, JIT compiler performance, and non-heap memory usage, we provide valuable insights into the health and performance of your runtimes. Understanding these metrics is crucial for developing effective root cause analyses (RCAs) and ensuring your system runs smoothly. We'll guide you through the different types of metrics you can find and explain how to interpret them for optimal performance monitoring and troubleshooting.
Should you have any questions, please get in touch with academy@emagiz.com.
1. Prerequisites
- Expert knowledge of the eMagiz platform
2. Key concepts
We provide the user with much information coming from each of our runtimes. By segmenting this information into three levels (i.e., overview, key, and other), we provide the user with a means to quickly assess the status of runtime and dive deeper into these metrics. Having this information and understanding these graphs can be beneficial when asked to develop an RCA for a client.
3. Other metrics
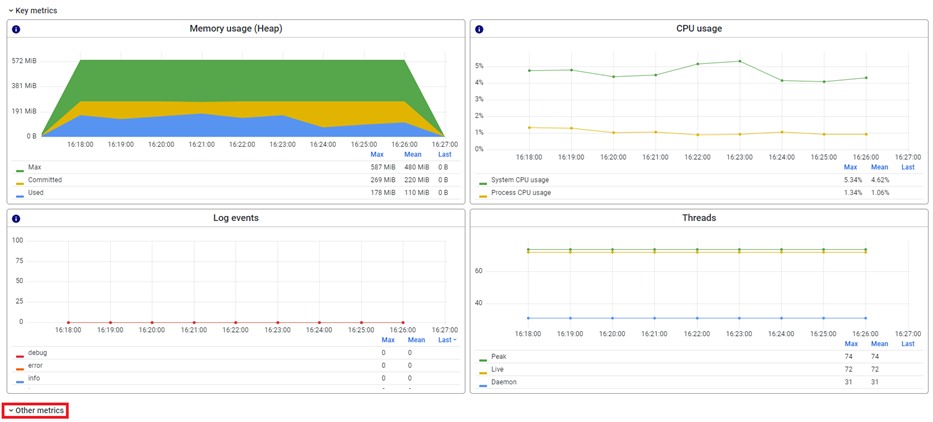
In this microlearning, we will build upon the knowledge gained in previous microlearnings and zoom in on each of the metrics provided by eMagiz in the "other" metrics segment. As a refresher, this overview can be found by navigating to the Manage phase of eMagiz and selecting the option Monitoring. Here you can choose the tab called "Runtime statistics." From there, you can zoom into a specific runtime by clicking on its name on the overview page. This will lead you to the following overview. By uncollapsing the "other" segment, you will see all "other" metrics that eMagiz exposes.
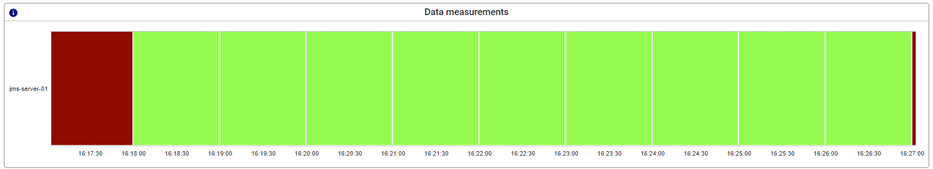
3.1 Data measurements
The first graph in the other section is the data measurements graph. This graph shows on a per-minute basis whether any metrics were received from the runtime. This is an excellent first indicator that a runtime might be in trouble; further investigation is warranted.
3.2 Memory management and garbage collection
eMagiz uses a high-performance, scalable, and secure Java virtual machine (JVM) to run the runtimes. For all this to work, we use various open-source libraries and products to ensure all the processes run as smoothly as possible.
For this, we use a generational garbage collector to manage memory. This means that objects are initially allocated in a "nursery" space, where they are short-lived and likely to be garbage-collected soon. Objects that survive multiple garbage collections are promoted to a "tenured" space, where they live longer and are less likely to be garbage-collected. In short, this is what the first four graphs you see below data measurements tell us.
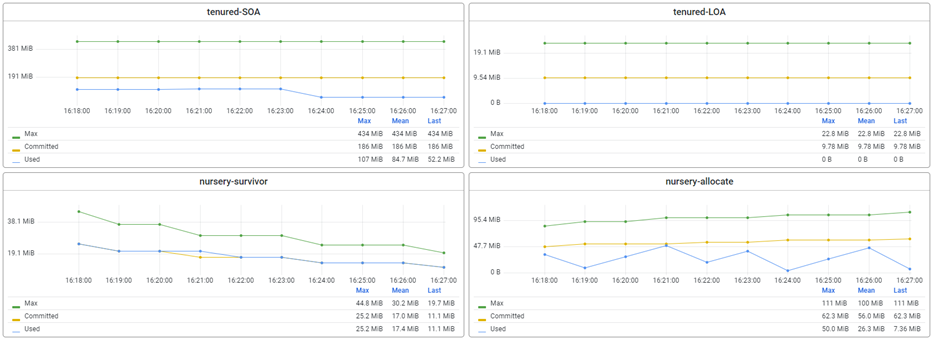
- Tenured-SOA: This metric measures the amount of MiB allocated to the "stop-the-world" phase of garbage collection for the tenured space. When garbage collection occurs, the JVM has to stop all application threads from performing the collection. The "stop-the-world" phase pauses the application while garbage collection is performed. The Tenured-SOA metric is vital because long stop-the-world pauses can negatively impact application performance.
- Tenured-LOA: This metric measures the amount of MiB allocated to the "concurrent" phase of garbage collection for the tenured space. During the concurrent phase, garbage collection is performed while the application threads run. The Tenured-LOA metric is important because it shows how much time is spent on garbage collection while the application is still running.
- Nursery-Survivor: This metric measures the amount of objects that survive garbage collection in the nursery space and are promoted to the tenured space. A high Nursery-Survivor amount means that the JVM is excellently identifying short-lived objects and collecting them quickly.
- Nursery-Allocate: This metric measures the amount of objects are allocated in the nursery space. A high Nursery-Allocate amount means that the JVM is allocating objects quickly, which can be good if those objects are short-lived and likely to be garbage-collected soon.
These metrics are related because they all inform how the JVM manages memory and garbage collection. For example, a high Tenured-SOA metric may indicate that the tenured space is getting too full and garbage collection is taking longer. A high Nursery-Allocate amount may indicate that the JVM is allocating too many short-lived objects, which can increase the load on the garbage collector. In addition, users can tune their flows and JVM settings to optimize performance and avoid memory-related issues by monitoring these metrics. More on this can be found here.
3.3 JIT (Just-in-time) compiler
A JIT compiler is a type of compiler that dynamically compiles code at runtime rather than ahead of time. It analyzes the code as it runs and generates machine code that is optimized for the specific hardware and operating system it is running on. For example, the JIT compiler typically stores the generated machine code in a cache to avoid the need to recompile the same code repeatedly.
The two graphs following our latest segment provide information on the JIT.
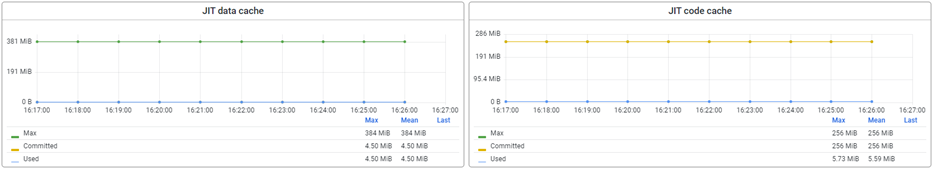
- JIT data cache: This metric measures the size and usage of the cache used by the JIT compiler to store data structures used during compilation. Examples of data structures that may be stored in the JIT data cache include symbol tables, type information, and intermediate code representations. The JIT data cache is essential because it can affect the performance of the JIT compiler, particularly if the cache becomes too small and the JIT compiler needs to load data from memory repeatedly.
- JIT code cache: This metric measures the size and usage of the cache used by the JIT compiler to store generated machine code. The JIT code cache is important because it can affect the application's performance, particularly if it becomes too small and the JIT compiler must repeatedly generate machine code.
These metrics are related because they both involve caching data used by the JIT compiler. However, they serve different purposes. For example, the JIT data cache stores data structures used during compilation, while the JIT code cache stores generated machine code. For example, a larger JIT code cache may require a larger JIT data cache to store the additional data structures needed to support the larger code cache.
In general, a larger JIT code cache can improve application performance because it reduces the need for the JIT compiler to generate machine code repeatedly. However, a larger JIT code cache also requires more memory, impacting overall system performance if memory becomes a bottleneck. Therefore, monitoring both the JIT data cache and the JIT code cache is important to ensure that they are correctly sized and utilized.
3.3 Non-heap related metrics
In a JVM, memory is divided into two main areas: the heap and the non-heap. The heap is where objects are stored, while the non-heap is used for various other purposes, such as class storage, thread stacks, and garbage collection data structures. The following metrics are related to the non-heap portion of the memory allocation on the JVM. We will look at this set in two steps. First, we look at the top two graphs in this segment and explain how they need to be interpreted. Finally, building on that, we will look at the following five graphs providing additional context.
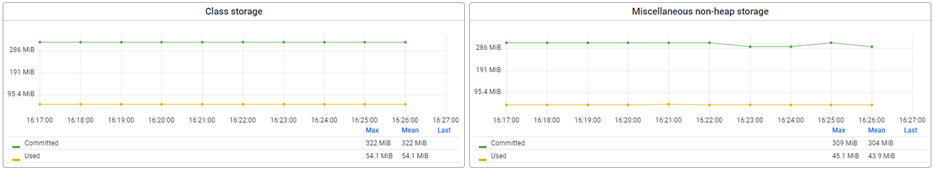
- Class storage: This metric measures the memory the JVM uses to store class metadata. Class metadata includes information about the structure of classes, such as their fields and methods, and is used by the JVM to load and execute classes. The Class storage metric is important because if it becomes too small, the JVM may need to repeatedly load and unload classes, which can negatively impact performance.
- Miscellaneous non-heap storage: This metric measures the amount of memory used by the JVM for various other purposes, such as thread stacks, direct memory buffers, and garbage collection data structures. The Miscellaneous non-heap storage metric is vital because if it becomes too large, it can consume memory that could be used for the heap, potentially causing the JVM to run out of memory.
In general, monitoring both the Class storage and miscellaneous non-heap storage metrics is essential to ensure that they are correctly sized and utilized. If either metric becomes too large or too small, it can impact the performance and stability of the JVM.
Now that we have a general idea of what these metrics tell us, it is time to delve deeper and look at what the following five graphs mean and tell us concerning the metrics we just discussed. The JVM buffer count, JVM buffer memory used, JVM GC data sizes, JVM GC memories, and JVM loaded/unloaded classes metrics are related to both the Class storage and miscellaneous non-heap storage metrics in a Java Virtual Machine (JVM) but in slightly different ways.
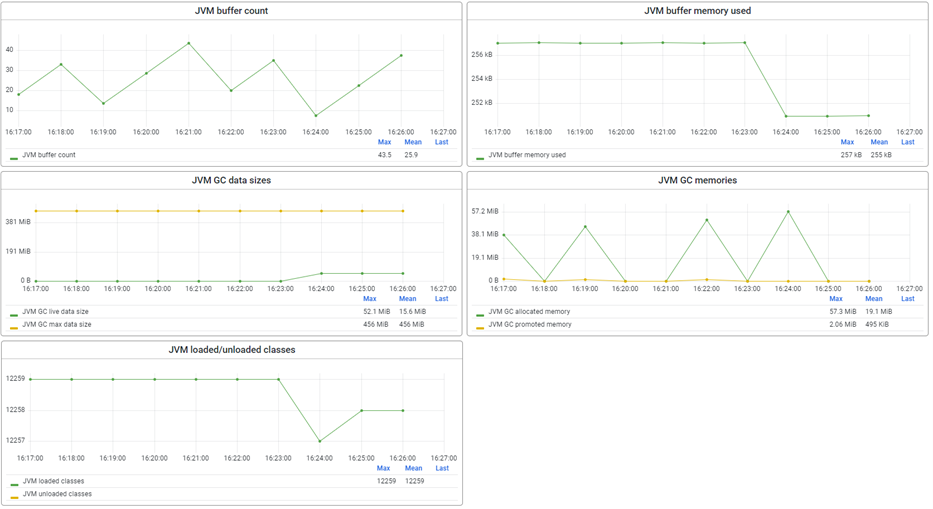
- JVM buffer count and JVM buffer memory used: These metrics measure the number and amount of direct memory buffer the JVM uses. Direct memory buffers are allocated outside the Java heap and used for high-performance I/O operations. These metrics are related to the miscellaneous non-heap storage metric because direct memory buffers are allocated from the miscellaneous non-heap area of memory. For example, suppose the JVM buffer count or memory used becomes too large. In that case, it can consume memory that could be used for other non-heap purposes, potentially impacting the overall performance and stability of the JVM.
- JVM GC data sizes and JVM GC memories: These metrics measure the size and memory usage of various data structures the JVM's garbage collector uses. These data structures include mark and sweep bitmaps, reference queues, and remembered set tables. These metrics relate to the Class storage and miscellaneous non-heap storage metrics. Some of the data structures used by the garbage collector are stored in the Class storage area, while others are stored in the miscellaneous non-heap storage area. If these metrics become too large, it can impact the garbage collector's performance and potentially cause the JVM to run out of memory.
- JVM loaded/unloaded classes: These metrics measure the number of classes loaded and unloaded by the JVM. Loaded classes are stored in the Class storage area, while unloaded classes are removed from the Class storage area, and their memory is returned to the miscellaneous non-heap storage area. These metrics relate to the Class storage metric because loaded classes are stored in the Class storage area. If the number of loaded classes becomes too large, it can impact the performance of the JVM's class loading and unloading mechanism.
3.4 Thread states
Continuing down the list of metrics available in the "other" section, we now arrive at a metric that should be viewed in isolation but is relevant for all runtimes you have running. For example, in a Java Virtual Machine (JVM), threads are the basic units of execution. Each thread represents a separate path of execution within the JVM and can perform different tasks simultaneously. However, threads can also be blocked, waiting, or idle at different times, depending on the program's state. In this metric, we report on the following three statuses.
- Runnable: Threads that are ready to run but have yet to be allocated a processor.
- Waiting: Threads waiting for a specific condition to be satisfied before continuing execution.
- Timed waiting: Threads waiting for a specific period before continuing execution.
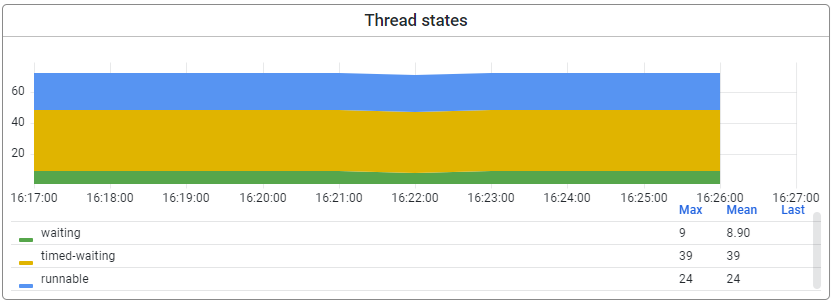
It's worth noting that the thread states metric can be affected by various factors, including the number of available processors, the complexity of the program being executed, and the efficiency of the thread scheduling algorithm used by the JVM. Therefore, it's essential to consider the context of the metric when interpreting its value.
4. Key takeaways
- We provide metrics to you as a user in three main areas.
- Memory management and garbage collection.
- JIT (Just-in-time).
- Non-heap memory.
- Each graph (with others) provides information that can be useful when performing an RCA.
- Context is important when interpreting these metrics.