
Interpret on-premise logging
In this microlearning, we will explore how to effectively find and analyze logs for an on-premise eMagiz runtime. Understanding where to locate the log files and how to interpret their contents is crucial for troubleshooting runtime errors. We will guide you through the process of retrieving the complete stack trace from the log, examining key details, and pinpointing the source of any issues.
Should you have any questions, please get in touch with academy@emagiz.com.
1. Prerequisites
- Intermediate knowledge of the eMagiz platform
2. Key concepts
This microlearning centers around interpreting the log for an on-premise runtime.
- With a log, we mean: A file that holds the logging related to that specific runtime.
3. Interpreting log on-premise
In some cases, the complete stack trace must be logged when something goes wrong on runtime. In eMagiz, only the top-level information is shown, and sometimes the entire stack trace. When this particular runtime runs on-premises, you can see the complete logging on the runtime level. In this microlearning, we will learn how to find the log and look through the log to find the corresponding error and subsequently analyze that error.
In a log, you see (among others) the following information:
- Start and stop information of flows or the complete runtime
- Manual logging you defined on flows running within that runtime
- Connection logging indicates whether there are connection problems
- Errors when something in an entry breaks down
3.1 Where to find the log
Before we can interpret the log, the first action will be to find the log. By opening the command prompt on the server on which your runtime(s) are installed, you can execute a command to retrieve a list of containers (i.e., runtimes) installed on the server that are relevant for your search parameter. Normally this would be a combination of the model and the environment. To make this command readable we will format the output of it. After running this command, you will see a list of all containers on your server. Now you can select the id of the container for which you want to retrieve the logs and copy this. Subsequently, you need to execute a second command to see the log in the command prompt.
docker logs {containerid}
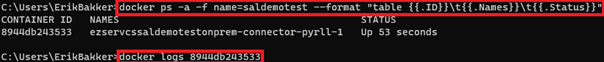
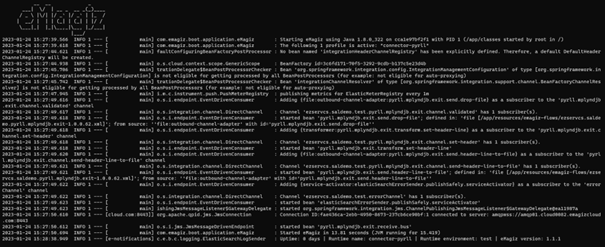
After executing the second command, the log will be shown to you in the command prompt interface. This will show the complete logging that is available and will show the latest information at the bottom. An example of how this looks can be seen below.
3.2 Find additional information
Now that we know where to find the log, the next step is to analyze the log. The most logical scenario to arrive here is when you see an error in the eMagiz Manage phase that could not be explained without looking at the complete stack trace. Then, by opening and analyzing the log, you can find the whole stack trace to perform your RCA on the problem at hand.
When you have the timestamp (in UTC) of when the logging was triggered, you can alter the command we just executed to retrieve the logs. Adding an option to the command can show the log from a specific moment.
docker logs --since 2023-01-26T07:23:37Z {containerid}
You could go one step further by combining a since and until option to the command to get a precise output surrounding the time you want to see the logging. So you can do that with the following command.
docker logs --since 2023-01-26T07:23:37Z --until 2023-01-26T07:24:38Z {containerid}
With this information, you can easily track down additional logging for an on-premise container (i.e., runtime) for yourself.
4. Key takeaways
- The karaf.log file can be found in the folder called log within the data directory of your runtime installation.
- Use text editors like Notepad++ to efficiently search and navigate through the log files.
- Use timestamps from the eMagiz>Manage page to perform targeted searches within the logs for more precise error tracking.
5. Suggested Additional Readings
If you are interested in this topic and want more information, please read the help text provided by eMagiz and check out these links: