
Swagger UI
In this microlearning, we will focus on the Swagger UI. We will explore how Swagger UI can be a crucial tool for testing and sharing your API Gateway. Swagger UI not only allows you to view and interact with your API’s specifications, but also provides essential details such as authorization, HTTP resource paths, operations, schemas, and example messages.
If you have any questions along the way, feel free to reach out to us at academy@emagiz.com.
1. Prerequisites
- Basic knowledge of the eMagiz platform
2. Key concepts
This microlearning centers around the Swagger UI page.
- With Swagger UI, we mean a user interface that (external) parties can access via the browser to see the specifications of your API Gateway and test their solutions simultaneously.
- With API Gateway, we mean a collection of RESTful API operations that can be published to the outside world to give them access to applications linked to your business process.
3. Swagger UI
The Swagger UI is a user interface that external parties can access via the browser to see the specifications of your API Gateway and test their solutions simultaneously. The Swagger UI comes with:
- Authorization
- HTTP Resource Paths
- HTTP Operations
- Schema's (if defined)
- Example messages (if defined)
Based on your initial configuration in the Design phase, eMagiz will generate the Swagger UI for you. When developing, eMagiz will utilize your gateway definitions to create schemas and example messages. Furthermore, it will use the configured paths and operations from the catalog to define them in the Swagger UI and link the schemas and example messages to each operation. On top of that, it will look at the configured authorization and explain it in the Swagger UI overview.
3.1 Updating Swagger UI
After the initial configuration is done in Design, many scenarios trigger an update of the Swagger UI file generated by eMagiz. The main scenarios are listed below. In this microlearning, we dive into this topic in more detail.
- Add a new integration to Create
- Update a definition in Create
- Change datatype
- Change/Add/Delete enumeration values
- Update an integration in Design
- Change path
- Change gateway message
- Change HTTP operation
- Change parameters
3.2 Access Swagger UI
You can access the Swagger UI when your solution is running (on the cloud or on your local device).
If you run the gateway in the eMagiz Cloud, for all environments, you can access the Swagger UI page in two ways. The first option is to press the Swagger UI button in Releases (when selecting the API Pattern).

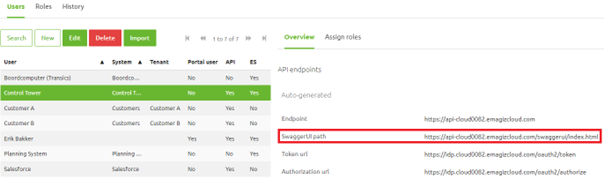
The other is via User Management in Deploy. Here, you can select a user to get to the Swagger UI Path, which can be copied and pasted into a new tab in your browser.
3.2.1 Access Swagger UI on your local device
In case you want to run your API Gateway solution on your local device for testing purposes, you can access the Swagger UI by opening a new browser tab and entering the following URL:
- http://localhost:{gateway.entry.port}/swaggerui/index.html
You must replace the {gateway.entry.port} with the default port that eMagiz defines. This will always be port 9091. So the URL would be:
- http://localhost:9092/swaggerui/index.html
3.3 Reading Swagger UI
After you have accessed Swagger UI, you will see all endpoints available for your API Gateway implementation.
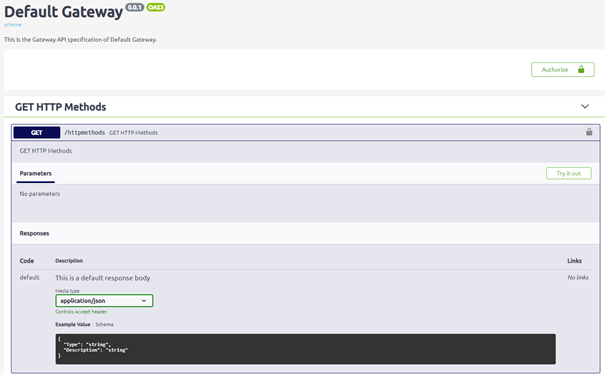
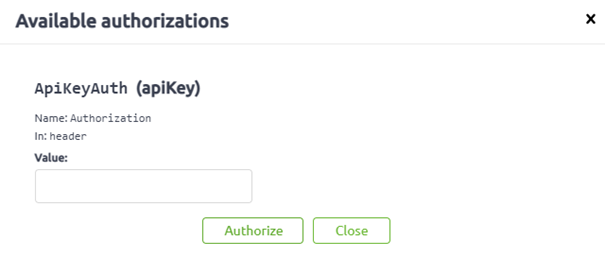
As you can see from the overview, you first encounter the Authorize button.
By clicking on that, you will see a pop-up where you need to fill in the authorization details—in this case, a valid API Key.
Below, you see all operations grouped per tag (if applicable). If the operations don't have a tag, they are alphabetically sorted. In this simple example, we only have one operation on one integration, as you can see.
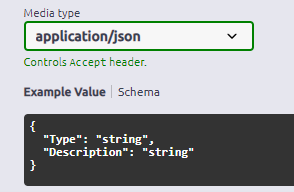
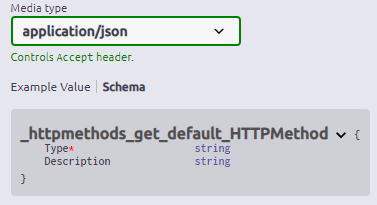
By clicking on an operation, you can see the detailed information of that operation. Here, you can see the Example Value and Schema. You can see what is mandatory in the Schema, indicated by the red asterisk icon in front of the attribute or element.
3.3 Testing with Swagger UI
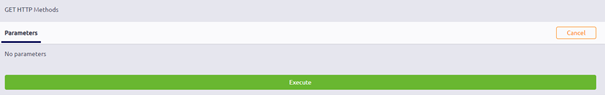
Furthermore, there is a "try-it-out" button. After you press this button, a button called Execute will appear.
By pressing this button, you will test the API Gateway functionality.
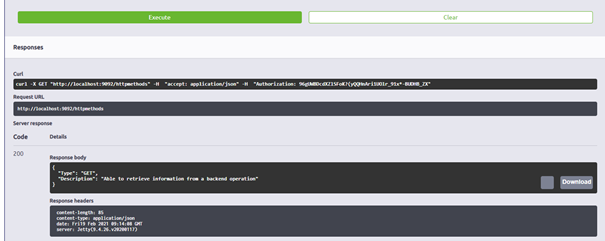
The Swagger UI will give feedback based on what happened after you have pressed the button to execute
3.4 Disabling Swagger UI
Your Swagger UI is publicly accessible and does not require authentication. If your API Gateway exposes sensitive operations or you have concerns about sharing details of your APIs with the public, you may choose to disable the Swagger UI. Keep in mind that doing so means you will need alternative ways to test your APIs and provide API documentation to consumers.
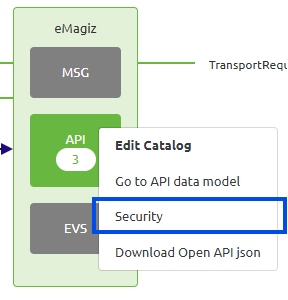
To disable your Swagger UI, open the API context menu in Design and open the API security page. Once you disabled your Swagger UI here, you will have to deploy a new release to apply the change.
4. Key takeaways
- Swagger UI provides a comprehensive view of your API Gateway, including details on:
- Authorization
- HTTP Resource Paths
- HTTP Operations
- Schema's (if defined)
- Example messages (if defined)
- Swagger UI gives the external party an option to test the various operations.
- You can access Swagger UI via the eMagiz Cloud or locally on your device, making it versatile for both development and testing environments.
5. Suggested Additional Readings
If you are interested in this topic and want more information, please read the help text provided by eMagiz and the following link.