
Interpreting Runtime Statistics
This microlearning focuses on interpreting runtime statistics to better understand the health of your system. By analyzing these statistics, you can uncover patterns and insights that reveal how well your runtime is performing. We’ll guide you through the key principles of interacting with the runtime graphs and offer practical tips for troubleshooting issues based on the data you see.
Should you have any questions, please contact academy@emagiz.com.
1. Prerequisites
- Basic knowledge of the eMagiz platform
2. Key concepts
This microlearning centers around interpreting runtime statistics.With interpreting we mean: Analyzing the patterns based on the information presented to you. With runtime statistics we mean: Various information elements on system (runtime) level that will help to understand the health of the runtime.
2.1 General interaction principles
All graphs in the Manage phase are created with the aim to provide an easy interaction for users to slice the information as needed. Here are some general guidelines for that interaction.
- Runtime, Queue and HTTP metrics are send to the Manage phase every minute and that interval is runtime specific
- Logs and error messages are send instantly to the Manage phase
- The average value of the last minute of each metric is sent to the Manage phase
- You can select the time dimension via the graph itself or via the top right menu. Other graphs will also respond to this selection
- You can return to the main dashboard via the top right button called "Show Main Dashboard"
- The main dashboard contains filter options to select specific runtimes or queues
3. Interpreting Runtime Statistics
Assessing the health of your systems is critical in a stable and robust integration solution. One of the aspects of assessing the health of your systems is looking at the runtime statistics.
To explain to you how you can correctly interpret the Runtime Statistics we have divided the following into three sections.
- The focus of the first section will be to explain each of the dashboard graphs separately to create a common understanding of what each of these graphs tells us.
- In the second section, we will highlight the relationship between these graphs to create more context on how to interpret the graphs in unison.
- The third section will focus on troubleshooting. In this section we have focused on some common cases we see happening and tried to explain which steps are needed and which reasoning is required to better analyze problems and prevent them in the future
To access the Runtime Statistics overview you navigate to Manage -> Monitoring -> Runtime Statistics.
3.1 Dashboard Graphs
When the runtime statistics are accessed, the first page shows a dashboard of the runtime statistics. An example is mentioned below.
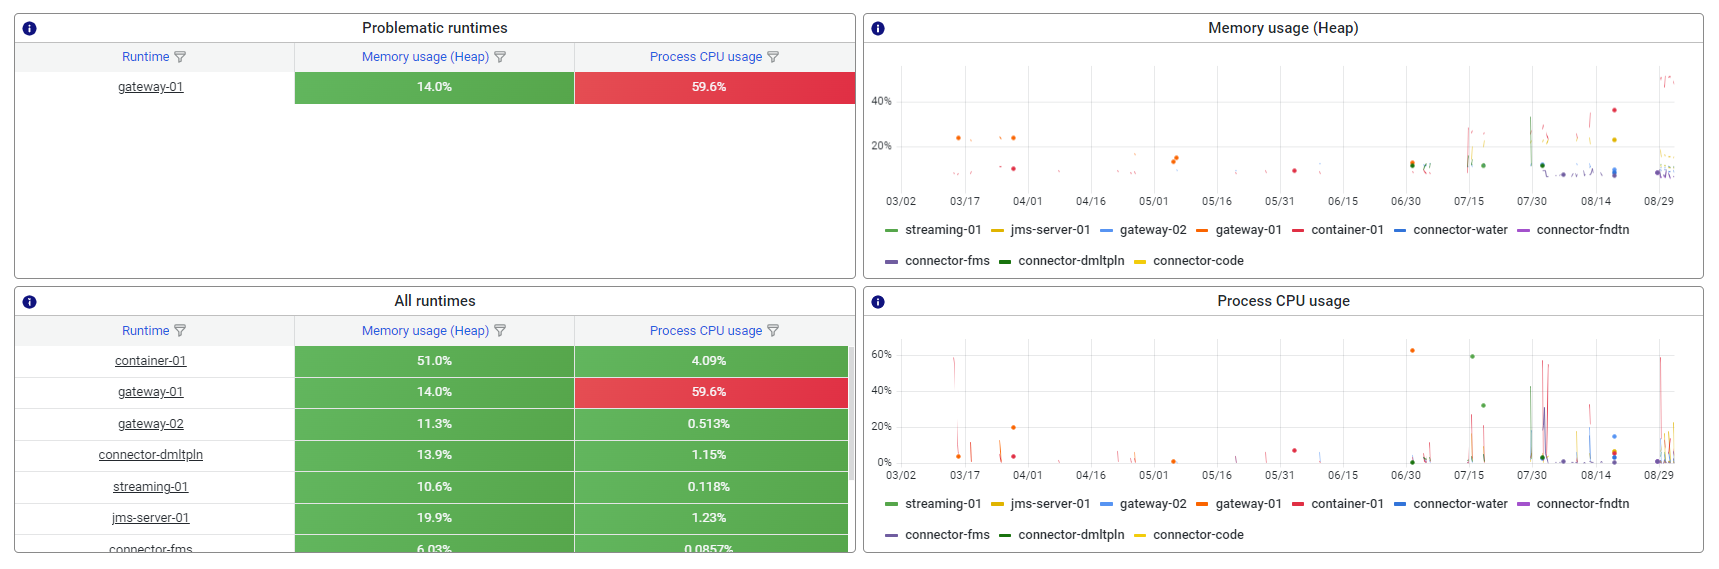
3.1.1 Problematic runtimes
The problematic runtimes are displayed top left in the quadrant. Problematic runtime are determined by the alerting setup of the model whereby a value in exces of the threshold on either Heap memory of CPU usage determines whether the runtime is considered problematic or not.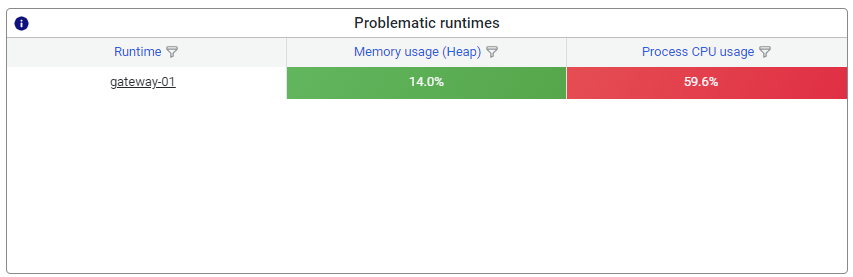
3.1.2 Display all runtimes
In the quadrant below you can see all runtimes and the reported memory or CPU usuage. In case there are many runtimes reported, use either the sorting option or the hourglass filter buttons.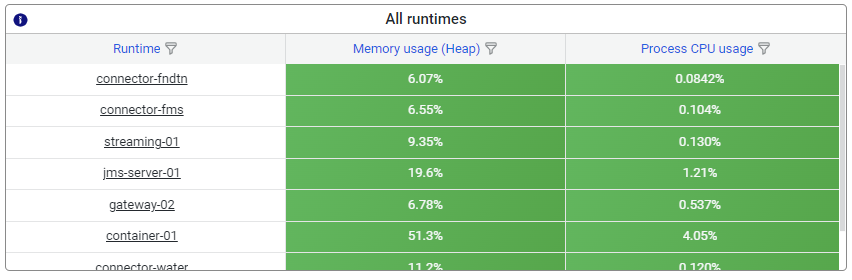
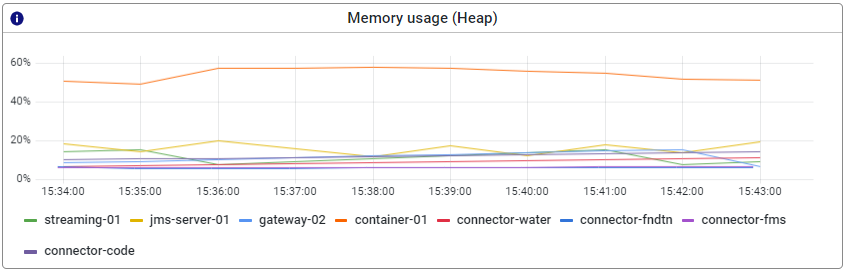
3.1.3 Memory usage - Heap
The heap memory section displays the way in which message traffic is impacting heap memory. Heap memory is used for processing messages including transformation and transport of messages through channels. Whenever the heap memory is high in % used, it means the assigned heap memory might be insufficient for the message traffic.
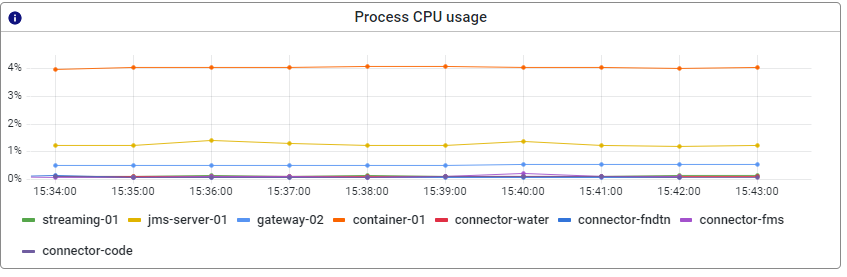
3.1.4 Process CPU Usage
This graph shows the usage percentage of the CPU assigned to the process (in this case runtime). The CPU is relevant for eMagiz as that component processes the message transformation, transport etc. A high percentage indicates that the CPU is very busy handling the message traffic of that process, which indicates that other processes handled by that same CPU(s) might experience delays or issues.
3.2 Relation between Dashboard graphs
In this section, we will highlight how the graphs shown on this page are connected. This way you get a better picture of how the various parts of the JVM act in unison.
- CPU usage and heap memory.
- An increase in both heap memory as well as CPU is a strong indication that a lot of traffic (in MBs) is being processed. This could be the result of a lot of messages being processed or one or a few large ones.
- A decrease in heap memory, from a high point, combined with a slight increase in CPU is a strong indication that garbage collection has kicked in.
- An explosive increase in both heap memory as well as CPU is a strong indication that the runtime might be having memory problems.
- A decrease in both heap memory, as well as CPU, is an indication that not a lot of messages are being processed
3.3 Troubleshooting
With the help of these graphs, you can analyze your runtimes. Below we have written out several scenarios that occur often.
- Alert that a high CPU percentage has been detected on a specific runtime.
- First thing to do in such a scenario would be to navigate to the runtime in question and see whether the CPU keeps on increasing or whether there was a temporary spike in CPU usage.
- Based on this observation you need to look at the other graphs, especially the one surrounding the heap memory to see whether the increase in CPU can be linked to an increase in heap memory. If both keeps on increasing this could indicate a memory problem. The advice would be to analyze whether the current heap memory settings are still valid
- If you see a decrease in heap memory slightly after the spike in CPU this is an indication that the runtime was temporarily busy with garbage collection (a standard process within Java) to free up memory. No further action is warranted
- If you see no or minimal effect on the heap memory but your CPU is spiking this could be due to someone installing a substantial number of flows on this runtime. Check again after all flows have been installed and started to see whether everything runs stable again. If so, no further action is necessary.
If you still see strange behavior you should check under the log entries and/or with other related runtimes to see if you can see a causal relationship between the both of them.
- Alert that the amount of heap memory used is above a threshold.
- First thing to do in such a scenario would be to navigate to the runtime in question and see whether the heap memory keeps on increasing towards the limit or not.
- The moment it keeps on climbing there will probably be an out-of-memory error. You can confirm this by looking at the log entries of the runtime.
- Out of memories also affect that statistics won’t be coming through anymore. This means that another way of verifying whether an out of memory might have occurred is to see whether the statistics disappeared (be aware the statistics are shown once per minute so be patient).
- All three observations together give you the conclusion that an out of memory has occurred.
- The moment the heap memory peaks and then drops (zigzag pattern) is a strong indicator that garbage collection has kicked in to free up memory for future use.
4. Key takeaways
- There are four dashboard graphs that will help the analysis of a runtime(s)
- Problematic runtimes are indicated by high CPU and memory usage.
- The added value lies in combining the information from each of them into a coherent interpretation