
Signal received - Recovery Needed
In this microlearning, we'll guide you through the essential steps to analyze and respond to system alerts that may indicate a need for recovery actions. We’ll cover various scenarios, such as server downtime or message traffic issues, and provide clear instructions to help you resolve these problems efficiently. By understanding these key signals and how to address them, you'll be better equipped to maintain system stability and minimize downtime.
Should you have any questions, please contact academy@emagiz.com.
1. Prerequisites
- Expert knowledge of the eMagiz platform
- Received a signal that something is going wrong
2. Key concepts
In this microlearning, we have detailed how to analyze whether recovery is needed and the steps you need to take based on certain signals.
- We will discuss various alerts (i.e., signals) you can receive that might require action.
- Per alert, we will determine how you can best execute your analysis.
- If applicable, we detail what to do when your actions prove unsuccessful.
3. Signal received - Recovery Needed
In this microlearning we have detailed how you can analyze whether recovery is needed. On top of that we have detailed the steps you need to take based on certain signals.
We will discuss the following signals:
- No messages can be send to system X
- Live server seems to be down
- Backup server does not start up after failback scenario
- Connector / Runtime seems to be down
- Number of consumers is less than threshold
- Out of memory log entry
3.1 No traffic reported related to the runtime for which you have received the alert
- Log in to eMagiz.
- Open the bus for which you have received the alert, navigate to ‘Manage’ and select the ‘Production’ environment.
- Determine how to proceed.
- Runtime statistics indicate nothing is happening for some time now
- Check messages in queue.
- Check runtime overview. Determine whether the relevant runtime (i.e. Container) is active.
- Yes -> Continue with step 4.
- No -> In case you are dealing with a failover bus, check whether the backup JMS Server is running, by executing the process as described above.
- Yes -> Backup should handle the message traffic. Please check out the Check message traffic section for what to do next.
- No -> Restart live and/or backup server.
- Runtime statistics indicate that statistics are coming in.
- Continue with step 4
- Runtime statistics indicate nothing is happening for some time now
- Confirm messages are being consumed from the queues and verify in the application itself (by yourself or with the help from someone else) whether messages arrive and are being processed. For help, see Check message traffic.
- In case the above does not explain why the alert was triggered please check several other models running the same architecture to verify whether they experience similar problems (Messages missing for multiple environments). If so, please contact support for assistance.
3.2 Both live JMS as well as backup JMS are reportedly down
- Log in to eMagiz
- Open the bus for which you have received the alert, navigate to ‘Manage’ and select the ‘Production’ environment
- Determine how to proceed.
- Runtime statistics indicate nothing is happening for some time now
- Check messages in queue.
- Check runtime overview. Determine whether the relevant runtime (i.e. JMS Server) is active.
- Yes -> Continue with step 4.
- No -> In case you are dealing with a failover bus, check whether the backup JMS Server is running, by executing the process as described above.
- Yes -> Backup should handle the message traffic. Please check out the Check message traffic section for what to do next.
- No -> Restart live and/or backup server.
- Runtime statistics indicate that statistics are coming in.
- Continue with step 4
- Runtime statistics indicate nothing is happening for some time now
- Confirm messages are being consumed from the queues and verify in the application itself (by yourself or with the help from someone else) whether messages arrive and are being processed. For help, see Check message traffic.
- In case the above does not explain why the alert was triggered please check several other models running the same architecture to verify whether they experience similar problems (Messages missing for multiple environments). If so, please contact support for assistance.
3.3 Backup server won’t come up again after restarting the live JMS
- Log in to eMagiz
- Open the bus for which you have received the alert, navigate to ‘Manage’ and select the ‘Production’ environment
- Navigate to the sub tab ‘Monitoring’ and select the ‘Log Entries’ option in the left hand panel.
- Check whether a certain logging line is present in the eMagiz logs. Search for each of the following values in the field message via separate searches: ‘Java heap space’ or ‘Out of memory’ or ‘I/O error’ or ‘Metaspace error’
- Yes -> Inform customer that the backup is currently not working and discuss with your colleagues, support and the customer for a suitable time window to get the backup up and running again.
- No -> Continue with step 3.
- Check whether a certain logging line is present in the eMagiz logs. Search for each of the following values in the field message via separate searches: ‘Java heap space’ or ‘Out of memory’ or ‘I/O error’ or ‘Metaspace error’
- Navigate to the sub tab ‘Monitoring’ and select the ‘Log Entries’ option in the left hand panel.
- IIn case you reach this step, verify that the number of consumers on a container runtime is two.
- Yes -> No further action required.
- No -> Restart backup server. Restart live and/or backup server
3.4 Runtime is down
- Log in to eMagiz
- Open the bus for which you have received the alert, navigate to ‘Manage’ and select the ‘Production’ environment
- Determine how to proceed.
- Runtime statistics indicate nothing is happening for some time now
- Check messages in queue.
- Determine whether the check you have executed as part of the previous step indicates that the runtime is down.
- Yes -> Runtime should be restarted
- Navigate to ‘Deploy’, ‘Architecture’ and select the ‘Production’ environment. Search for the runtime that is not working anymore.
- Determine on the basis of the search where the connector is running.
- In case of a cloud connector you can restart the connector via this page. Restart a runtime
- Restart not successful -> Contact support for assistance as they can check the logs in the eMagiz Cloud.
- Restart successful -> No further action needed.
- In case of a cloud connector you can restart the connector via this page. Restart a runtime
- No -> Temporary connection loss between eMagiz cloud and runtime. If message traffic works as expected consider this an incident and log an RCA with support.
- Yes -> Runtime should be restarted
- Runtime statistics indicate that statistics are coming in
- Confirm that messages are indeed consumed from the queue and check whether messages arrive and are being processed
- Messages arrive -> Continue with step 4.
- Messages do not arrive -> Continue with the step below.
- In case your runtime statistics are coming in but no messages are consumed and delivered please see Solve the problem where there is no traffic between eMagiz and the runtime for which you have received the alert.
- Confirm that messages are indeed consumed from the queue and check whether messages arrive and are being processed
- Runtime statistics indicate nothing is happening for some time now
- Log an RCA with support for further analysis
3.5 Too few consumers reported
- Did you receive an alert that there are too few consumers on queue?
- Yes -> Navigate to ‘Manage’ and select ‘Queue Statistics’ on the ‘Production’ environment from the left hand panel. Check various flows that are running on this runtime. The queue statistics should indicate that the number of consumers have been dropped from 2 to 1 or from 1 to 0.
- Success -> This means that this specific runtime is indeed down. See Restart a runtime to restart the runtime in question.
- Check whether the number of consumers is back to the expected level
- Yes -> Problem solved
- No -> Potentially there are bigger issues on JMS Server level. Navigate to Solve the problem where both live JMS as well as backup JMS are down.
- Check whether the number of consumers is back to the expected level
- Failure -> This means the consumer count works as expected. Consider this an Incident.
- Success -> This means that this specific runtime is indeed down. See Restart a runtime to restart the runtime in question.
- Yes -> Navigate to ‘Manage’ and select ‘Queue Statistics’ on the ‘Production’ environment from the left hand panel. Check various flows that are running on this runtime. The queue statistics should indicate that the number of consumers have been dropped from 2 to 1 or from 1 to 0.
3.6 Restart a runtime
- Navigate to ‘Deploy’, ‘Architecture’ and select the ‘Production’ environment if you are not yet on this page
- Press Start Editing
- Search for the runtime for which you have received the alert and activate the drop down menu via a right click of your mouse
- Select Restart Runtime.
- Check traffic of messages, see Check message traffic.
- Success -> Tell customer that messages are once again delivered correctly
- Failure -> Check whether runtime exists in eMagiz Cloud.
3.7 Reset a runtime
- Navigate to ‘Deploy’, ‘Architecture’ and select the ‘Production’ environment if you are not yet on this page
- Press Start Editing
- Search for the runtime for which you have received the alert and activate the drop down menu via a right click of your mouse
- Select Reset Runtime.
- Check traffic of messages, see Check message traffic.
- Success -> Tell customer that messages are once again delivered correctly
- Failure -> Check whether runtime exists in eMagiz Cloud.
3.8 Restart live and/or backup server
- Navigate to ‘Deploy’ and select the ‘Production’ environment.
- Check runtime overview. Determine whether the relevant runtime (i.e. JMS Server) is active.
3.8.1 Option A
Are both the live and backup server down? The following steps describe the least risky option, but is also the most time consuming option.
- Stop backup server
- Go to ‘Deploy’, ‘Architecture’ and press Start Editing
- Right mouse click on the machine where the backup JMS runtime is running on and select Stop machine
- Stop live server
- Go to ‘Deploy’, ‘Architecture’ and press Start Editing
- Right mouse click on the machine where the live JMS runtime is running on and select Stop machine
- Start live server
- Go to ‘Deploy’, ‘Architecture’ and press Start Editing
- Right mouse click on the machine where the live JMS runtime is running on and select Start machine
- Start backup server
- Go to ‘Deploy’, ‘Architecture’ and press Start Editing
- Right mouse click on the machine where the backup JMS runtime is running on and select Start machine
- Check message traffic
- Success -> Communicate to the customer that messages arrive again
- Failure -> Contact support for assistance as they can check the logs in the eMagiz Cloud
3.8.1 Option B
If uptime and speed in which actions are executed are of importance please follow the steps detailed below.
- Restart the JMS (live) runtime
- Navigate to ‘Deploy’, ‘Architecture’ and press Start Editing
- Right mouse click on the JMS runtime and select Restart Runtime
- Restart the JMS (backup) runtime
- Navigate to ‘Deploy’, ‘Architecture’ and press Start Editing
- Right mouse click on the JMS runtime and select Restart Runtime
- Check message traffic
- Success -> Communicate to the customer that messages arrive again
- Failure -> Contact support for assistance as they can check the logs in the eMagiz Cloud
3.8.1.1 Double Lane variant
Is live server down but is the backup running or vice versa?
- Stop live server or backup server (depending on which of the two are down)
- Navigate to ‘Deploy’, ‘Architecture’ and press Start Editing
- Right mouse click on the JMS runtime and select Stop Runtime
- Start live server or backup server (depending on which of the two are down)
- Navigate to ‘Deploy’, ‘Architecture’ and press Start Editing
- Right mouse click on the JMS runtime and select Start Runtime
- Check runtime statistics under ‘Manage’
- Success -> Communicate to the customer that both servers are up and running again
- Failure -> Check message traffic
- Success -> Open an RCA for the project team and or support to identify why the problem occurred.
- Failure -> Contact support for assistance as they can check the logs in the eMagiz Cloud.
3.9 Check runtime statistics
- Navigate to the sub tab ‘Monitoring’ and select the ‘Runtime Statistics’ option in the left hand panel.
- Check for all relevant runtimes whether the runtime statistics are indeed missing.
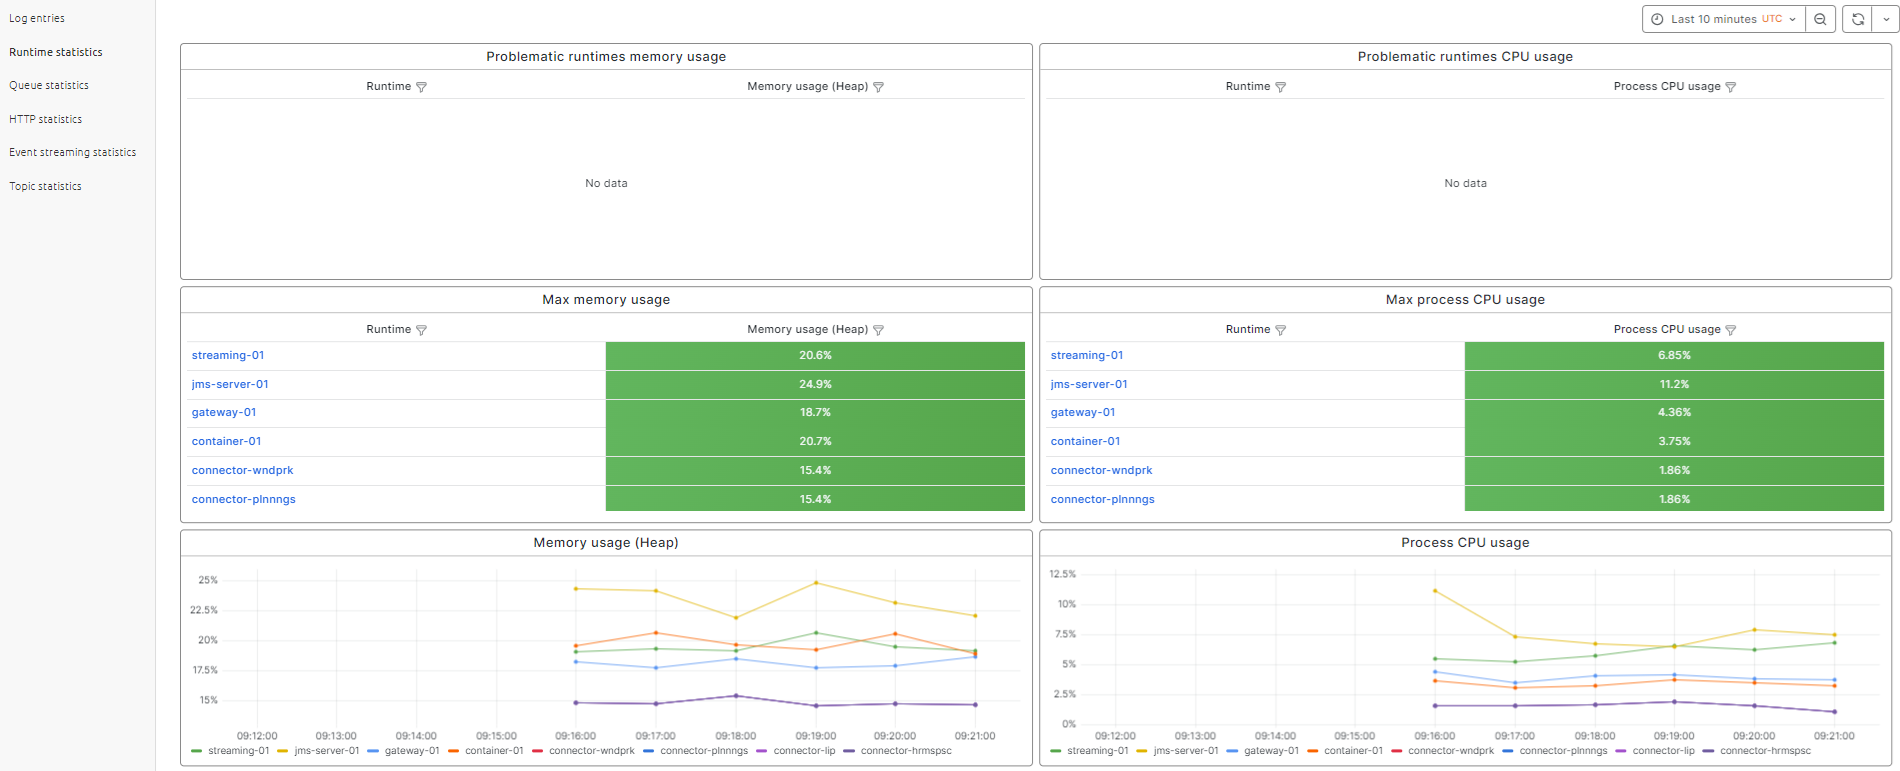
- Check for all relevant runtimes whether the runtime statistics are indeed missing.
- Check for the last measured point in time to determine whether this time matches the current time in UTC.
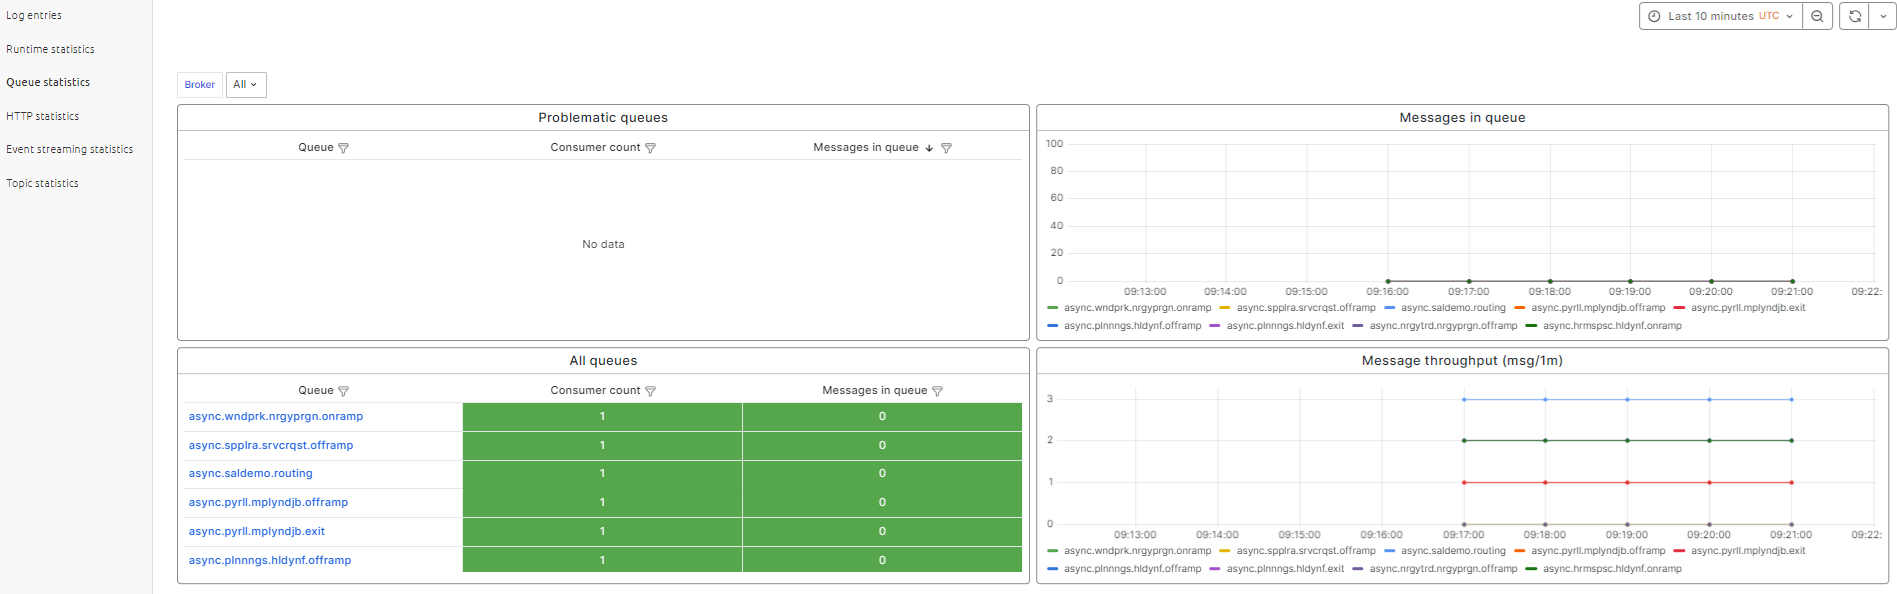
3.10 Check messages in queue
- Navigate to ‘Manage’, ‘Monitoring’ and select ‘Queue Statistics’ in the left hand panel.
- Check whether there are a lot of messages residing in queues towards this system.
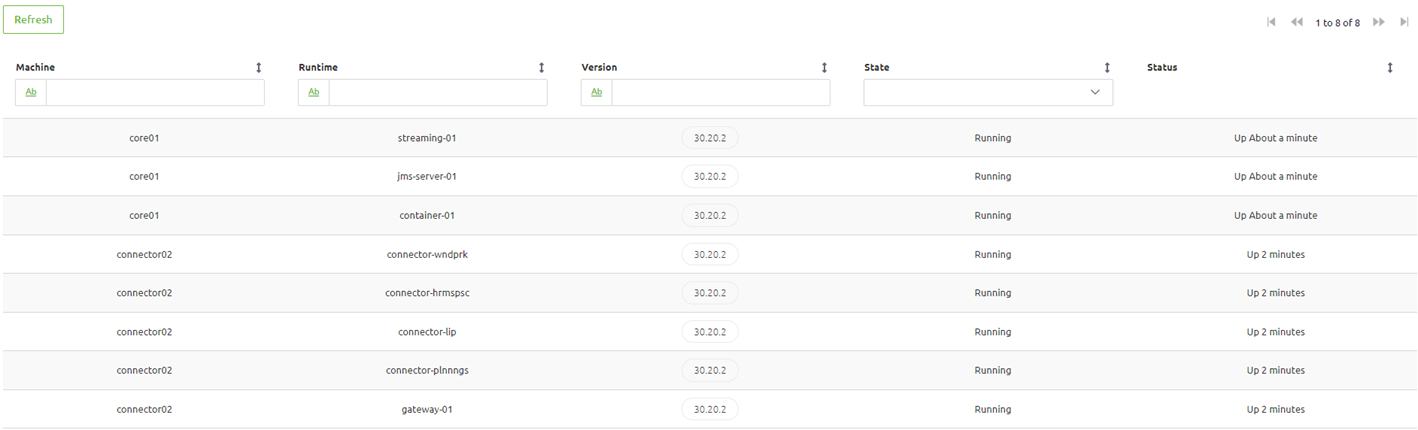
3.11 Check runtime overview
- Navigate to ‘Deploy’, ‘Runtime Overview’.
- Verify whether the runtime in question is Active. This can be done by searching for a keyphrase (i.e "jms-server") and verifying whether the "state" is Running.
3.12 Check message traffic
- Navigate to ‘Manage’ and select the option ‘Queue Statistics’ in the left hand panel. Check the various flows that are of relevance for this particular integration. For this integration you should see messages flowing through each step. Be aware, the number of messages does not have to be equal in each step due to the possibility of filtering messages in between.
- Success -> This means everything works again as expected. If you happen to have access to the application that should receive the data you always have the extra option to log in and verify if the messages indeed have arrived
- Failure -> This means that messages are still not being delivered. In most cases this is due to problems on JMS level. Advice is to restart the JMS runtime. See Restart live and/or backup server.
3.13 Check whether runtime is actually deployed
- Navigate to ‘Deploy’, ‘Architecture’ and select the ‘Production’ environment if you are not yet on this page
- Search for the runtime that is not running and see if you can find it
- Yes, check the background color of the runtime and proceed with step 3
- No, navigate to ‘Design’, ‘Architecture’. Select ‘Production’ and continue with step 6
- Background color of the runtime is
- White with a green outside line. Continue with step 4
- White with a blue outside line. Continue with step 4
- White with a red outside line. Continue with step 5
- Dark blue with a dark blue outside line -> Reset a runtime in AWS.
- If you arrived at this step this means that a change to Architecture has not yet been committed to the eMagiz Cloud. To commit these changes execute the following steps in order
- Press Start Editing
- Press Apply to Environment and wait for the conformation from eMagiz that the update is committed to the eMagiz Cloud
- Check message traffic
- If this control renders success your runtime is (again) running as expected
- If this control does not render success please contact support to verify what the logs within the eMagiz Cloud tell with regards to why this runtime is not active
- If you arrived at this step this means that the runtime that is not running actually needs to be removed from the eMagiz Cloud
- If this is indeed true, continue with step 4
- If this is not correct navigate to ‘Design’, ‘Architecture’ and select ‘Production’. Please continue with step 6 afterwards
- If you arrived at this step you have arrived at the conclusion that the Architecture is not conform what actually should be running on your environment. In these cases you need to execute the following actions
- Press Start Editing
- Press Apply to Environment
- Place runtime on the machine it should be running on
- Press Stop Editing
- Navigate back to step 2 and follow the steps from there
3.14 Check whether statistics are missing for multiple bus environments
- Select a number of other buses and verify under ‘Manage’ whether those buses do have statistics (queue, runtime, etc.)
- Success -> Problem resides with the bus you are currently investigating. Restart of the JMS server is required. If the problem is only that statistics are missing please consult with the customer first before executing a restart of the environment
- Failure -> Contact the support department.
4. Key takeaways
- With this microlearning you can better analyze problems and recover your instances with little downtime
5. Suggested Additional Readings
If you are interested in this topic and want more information on it please read the help text provided by eMagiz and read the following link:
- 1. Prerequisites
- 2. Key concepts
- 3. Signal received - Recovery Needed
- 3.1 No traffic reported related to the runtime for which you have received the alert
- 3.2 Both live JMS as well as backup JMS are reportedly down
- 3.3 Backup server won’t come up again after restarting the live JMS
- 3.4 Runtime is down
- 3.5 Too few consumers reported
- 3.6 Restart a runtime
- 3.7 Reset a runtime
- 3.8 Restart live and/or backup server
- 3.9 Check runtime statistics
- 3.10 Check messages in queue
- 3.11 Check runtime overview
- 3.12 Check message traffic
- 3.13 Check whether runtime is actually deployed
- 3.14 Check whether statistics are missing for multiple bus environments
- 4. Key takeaways
- 5. Suggested Additional Readings